


Welcome to Instant OSSEC Host-based Intrusion Detection. This book will walk you through the installation, configuration, and customization of the OSSEC host-based intrusion detection system (HIDS). We will explore many features of OSSEC and how they can be used to improve the overall security, provide valuable insight into systems operations, automate the detection of false positives to provide relevant alerting data, and more.
In this chapter we'll download, install, and configure a simple OSSEC local profile. This profile incorporates all of the OSSEC's features into a single installation that will work on its own. OSSEC also supports a server-agent model, where a dedicated server profile provides aggregation and analysis for every agent profile.
So, what is it we're getting ourselves into? OSSEC is an acronym for Open Source SECurity Event Correlator. OSSEC monitors systems for events in logfiles and processes on the filesystem through the use of commands and outputs. It decodes the data, extracting valuable information, and analyzes it in context.
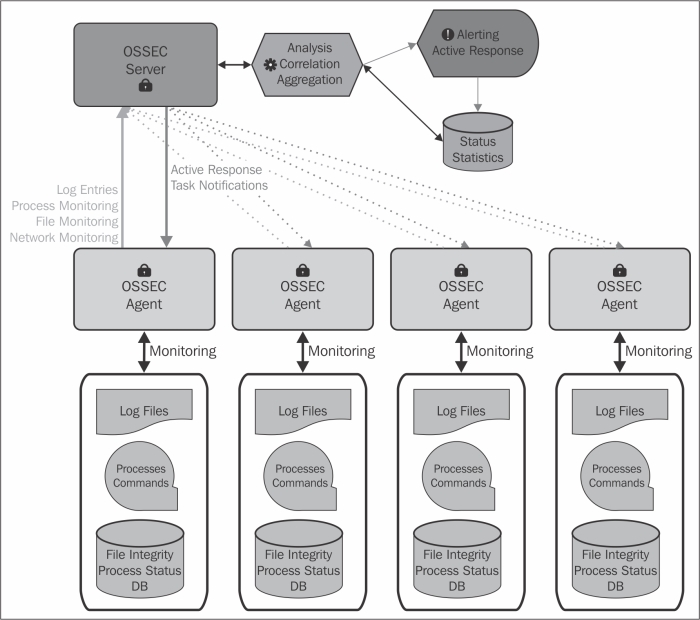
As the previous diagram shows, the analysis and correlation is used to generate alerts, either e-mails or logs, or active responses. Active response is a simple framework for running a script or program within the context of the alert. Using active response, we can call a firewall script with the source IP that just failed to log in to our server via SSH.
The functionality of the local profile is identical to that of the server-agent model, except all components function locally. Let's start out with a simple local profile installation.
To install OSSEC from source, you will need only a C compiler available on the system and the superuser access. OSSEC does not require any external libraries and builds its own self-contained binaries to avoid corruption or deception should your server be compromised.
Generally, most Linux/BSD operating systems ship with or have a C compiler available. It's usually the GNU C compiler (GCC). If GCC isn't already installed, you can simply consult your system's package manager to install it on any Linux- or BSD-based systems.
Now the only thing left to prepare is downloading and extracting the source tarball. You can retrieve the proper archive file from http://www.ossec.net/?page_id=19. Download the latest stable release, extract it, and change its directory into the folder created for extracting the archive.
OSSEC developers provide a wrapper script to encapsulate the configure, build, and install process into a single, prompted installation. The installation is guided, but we can look at a few important prompts along the way:
To get started, run the installation script with superuser privileges as follows:
$ sudo ./install.shThe first important question is what type of installation we will be performing:
1- What kind of installation do you want (server, agent, local, hybrid or help)?The simplest configuration is the
localprofile. This configures OSSEC as a standalone daemon analyzing and correlating only locally to this system. It's a good starting point to get familiar with OSSEC.After a few simple questions, check for a prompt asking which analyzers to enable:
3.2- Do you want to run the integrity check daemon? (y/n) [y]:The integrity check daemon monitors your critical files and binaries for changes. This is usually referred to as file integrity monitoring or FIM.
3.3- Do you want to run the rootkit detection engine? (y/n) [y]:The rootkit detection engine is a combination of signature- and anomaly-based checks to discover the presence of popular or yet-to-be-discovered rootkits on Linux/BSD systems. It looks for out-of-place or hidden files and strange-network behavior.
3.4- Do you want to enable active response? (y/n) [y]:Active response provides a functionality to run scripts when alerts are triggered. This feature provides the capacity for OSSEC to move beyond a detection system into a prevention system. There are a few tested responses that come standard with OSSEC.
- Do you want to enable the firewall-drop response? (y/n) [y]:If you have an active response enabled, OSSEC ships with a firewall-drop response that works on almost every operating system, without modification, and creates a firewall rule to drop traffic coming from IPs identified by the rules as attackers.
- Do you want to add more IPs to the white list? (y/n)? [n]:If you have the firewall-drop response enabled, you'll be prompted to create a whitelist of IPs that will never be blocked by the active response system. If you have networks or IPs that you'd prefer not to be blocked, you can configure them here. Generally, critical systems should be excluded: DNS servers, LDAP servers, and mail servers. Without this protection, OSSEC may interrupt key communication channels during an attack. If you selected yes, use spaces to separate IPs and/or networks in CIDR notation, for example:
- IPs (space separated):
 192.168.0.0/23 10.0.0.0/8 1.2.3.4
OSSEC will now be built based on your answers to questions and information attained through the build tools on your system. If everything goes successfully, the last message you see should look something similar to the following:
Installation Completed.
If you don't see this message, check the error message and correct the issue. OSSEC is designed to build without external libraries but failures will occur if there's no C compiler found.
So, what just happened? There's a lot of output, so let's cover the highlights. The script configures and builds the OSSEC binaries. Once the compilation has completed, the OSSEC users and groups are created on the system if they do not exist. The OSSEC installation directory is created, and the binaries and configuration files we complied are copied into their permanent location on the filesystem. The script then verifies and repairs permissions in the OSSEC installation directory to ensure a working installation. If everything completes successfully, the last step starts the OSSEC daemons and begins analyzing your logs.
It's important that system administrators are aware of the user and group creation as they might be utilizing configuration management software and may wish to create the users and groups prior to running the installation script. The users created are:
ossec: This is the default OSSEC userossecm: This is the OSSEC mailer daemonossecr: This is the OSSEC remote daemon
A single group named ossec containing all these users is also created.
The end result of the process is a default configuration of OSSEC. By now, OSSEC is already gathering log data and analyzing your filesystem.
Congratulations! You just installed, configured, and started OSSEC to protect your server. An excellent first step in the mastery of OSSEC! You might also be thinking that there is a lot of work to run this setup process on each server, and you're right. It's not always desirable or possible to perform source installs on every server in your network. Luckily for us, there's a speedier way!
On most production systems, a C compiler may not available. Don't worry, it is still possible to deploy it on these systems without requiring administrators to install hefty development packages.
OSSEC provides a binary installer for Windows on the Downloads page (http://www.ossec.net/?page_id=19) of the site. This is an agent-only binary, so you will still require a Linux/BSD server to manage any Windows agents.
For Linux systems, there are two major package managers, RPM and APT. Distributions based on Red Hat use a binary package called an RPM. Atomicorp provides a handy installer for their nicely packaged OSSEC RPMs, which you can install using the following command on your Red Hat server:
$ wget -q -O - https://www.atomicorp.com/installers/atomic |sudo sh
After that, you'll be able to install the OSSEC server or agent through yum:
$ sudo yum install ossec-hids-server
Or for a client install, use the following command:
$ sudo yum install ossec-hids-client
If you intend to install it on a Debian-based Linux distribution, Nicolas Zin has packaged OSSEC for Ubuntu. His work is available at the following link:
https://launchpad.net/~nicolas-zin/+archive/ossec-ubuntu
Follow his instructions to enable the source in APT. Install OSSEC server by running the following command:
$ sudo apt-get install ossec-hids-server
Or for a client install, use the following command:
$ sudo apt-get install ossec-hids-agent
Integrating the deployment of OSSEC into your organization's configuration management solution is much easier with binary packaging. Servers receiving a binary package do not require a C compiler to be installed. This often fits within the organization's requirements to remove unnecessary software from its infrastructure.
Even though OSSEC may already be running, we need to make sure that we configure our installation to start during the operating system's boot sequence. This step varies depending on the operating system you're running. The easiest way to start OSSEC on Linux/BSD is to add the /var/ossec/bin/ossec-control start command to the /etc/rc.d/rc.local file, which is executed at boot.
If you've chosen the binary package install, chances are that the package provides an initialization script for your operating system. Most modern systems use an initialization script usually installed as /etc/init.d/ossec-hids, and the following commands will enable it:
Red Hat-based:
/sbin/chkconfig ossec-hids onDebian-based:
/sbin/update-rc.d ossec-hids defaults
The Microsoft Windows binary installer configures OSSEC to run at startup, so no additional steps are necessary.
The standalone or local configuration is perfect for managing a single server. If you have multiple servers, you'll want to use OSSEC in the server-agent model. Utilizing a server-agent model will allow agents to aggregate events and the server to make more informed decisions when alerting or taking an action.
In this example, we assume that the:
OSSEC server is 192.168.0.1
Our servers live on 192.168.0.0/23 (192.168.0.1 to 192.168.1.254)
We have an external MS Exchange server at 1.2.3.4
We also assume that you have successfully installed OSSEC. Otherwise, you can install it from the source or with a binary installer. To install from a source, use the install.sh command and select server as the installation type in the first step. Binary installers will label their server packages as ossec-hids-server.
In order to run OSSEC in server mode, you need to open up the UDP port 1514 on your firewalls from and to your OSSEC server.
Now that the server is ready, we'll have to double-check the remote namespace in the /var/ossec/etc/ossec.conf file:
To configure the remote daemon and to communicate with them, we just need to make sure that we implement the following configuration:
<remote>
     <connection>secure</connection>
     <allowed-ips>192.168.0.0/23</allowed-ips>
</remote>
Another key setting in server mode is the whitelist for active response. Set it up now as illustrated in the following configuration, even if you don't plan on utilizing the active response:
<global>
  <!—Our LAN -->
  <white_list>192.168.0.0/23</white_list>
  <!-- MS Exchange Server -->
  <white_list>1.2.3.4</white_list>
</global>
We will then verify and configure our e-mail settings as follows:
  <global>
    <email_notification>yes</email_notification>
    <email_to>security.alerts@example.com</email_to>
    <smtp_server>localhost</smtp_server>
    <email_from>ossecm@server.example.com</email_from>
  </global>
We can then establish our basic e-mail and log thresholds as follows:
  <alerts>
    <log_alert_level>1</log_alert_level>
    <email_alert_level>7</email_alert_level>
  </alerts>
Don't forget to restart the server for the changes to take effect:
$ sudo /var/ossec/bin/ossec-control restart
The simple configuration options we've specified for our server simply enable the secure communication over the UDP port 1514 between OSSEC clients and the server. We also configured the server to accept connections from our internal networks.
The best practice is to whitelist any IP addresses of potential agents as well as any known external business-critical resources. By whitelisting critical resources, we can ensure that OSSEC never interrupts service to those resources. Any resource that is critical in an emergency should be whitelisted, which is why we have whitelisted the external mail server.
Imagine being under attack and suddenly losing access to e-mail! The last two blocks configure OSSEC to send an e-mail on our network. If we need a specific SMTP server, we can tweak it here. Once we have our e-mail configured, we establish the thresholds for alerting at events whose level is 7 or higher. We will log any events whose level is 1 or higher.
Now that the server has been configured, this recipe covers how one can configure the clients to connect to the server to increase the intelligence and relevance of alerts.
In this example, we assume that the:
OSSEC server is 192.168.0.1
Our servers live on 192.168.0.0/23 (192.168.0.1 to 192.168.1.254)
We also assume that you have successfully installed OSSEC. You can install it from the source or with a binary installer. To install from a source, use the install.sh command and select agent as the installation type in the first step. Binary installers will label their agent packages as either agent or client. The Debian package is labeled ossec-hids-agent and the Red Hat package is labeled ossec-hids-client.
If you're using a binary package, the ossec.conf file will need to be updated. We need to point the OSSEC agent process to the correct server. For our example network, we'd modify the /var/ossec/etc/ossec.conf file to have its client section look similar to the following:
<client>
     <server-ip>192.168.0.1</server-ip>
</client>
The only other thing we need to do is to set up the client and server keys.
If you were to start OSSEC at this point, the ossec-agentd component would fail to start while the rest of the components would function. This is because you have not told the OSSEC server about the existence of this new agent. To do that, we need to create keys and import them on the client:
On the server, perform the following:
$ sudo /var/ossec/bin/manage_agents
****************************************
* OSSEC HIDS v2.7.1 Agent manager.     *
* The following options are available: *
****************************************
   (A)dd an agent (A).
   (E)xtract key for an agent (E).
   (L)ist already added agents (L).
   (R)emove an agent (R).
   (Q)uit.
Choose your action: A,E,L,R or Q:
Select
Ato add an agent. You will be prompted for that agent's fully qualified domain name and IP address. Once you've confirmed adding the agent, you'll receive the menu again. This time, you need to extract the agent key for importing the client, so selectEand enter the ID of the agent you just created. You'll be presented with an output that looks similar to the following:Agent key information for '001' is: MDAxIHNlcnZlci5leGFtcGxlLm5ldCAxOTIuMTY4LjAuMTUyIDgyZTZjNjI1ZDQ2ZmI2MDlkYTFmMDkxNDA2NTYwNTU2YWQyZGZhMTBmZGYwMGJlODcwNTAxYTcxNDY5MWMxMmY=
The agent key is Base64 encoded and in this case starts with
MDAx. Copy that key to your clipboard; on the client, run themanage_clientscript to import it:$ sudo /var/ossec/bin/manage_client **************************************** * OSSEC HIDS v2.7.1 Agent manager. * * The following options are available: * **************************************** (I)mport key from the server (I). (Q)uit. Choose your action: I or Q:
Choose
Ito import the key and paste the Base64-encoded string into the prompt. You should now see the key information decoded as:Agent information: ID:001 Name:server.example.net IP Address:192.168.0.152
If everything looks correct, press Y to import the key. At this point, the client and server are aware of each other, and you may start (or restart) OSSEC on the client as follows:
$ sudo /var/ossec/bin/ossec-control restart
This process creates the shared secret key between the OSSEC server and the client. With this key, and a combination of the ID and IP of the client, messages may pass safely between the server and client. This ensures that the commands coming in over UDP are legitimate commands from the server and not an attacker masquerading as the OSSEC server.
The /var/ossec/etc/client.keys key file on the OSSEC server should be considered sensitive and any unauthorized access to it should prompt serious actions, such as resetting the keys on all the clients. The client.keys file should be as restricted as possible on every system to prevent tampering. The default permissions allow only the group ossec to read the file.
Key management can slow down the automated deployments. Luckily, OSSEC fixed this in the version 2.5 with the introduction of the authentication daemon.
The manual key setup process is burdensome, especially if you'd like to deploy to hundreds or thousands of servers. To fix this, the ossec-authd file was introduced to provide a mechanism for an agent to request a key if one does not exist.
On the server, /var/ossec/bin/ossec-authd is installed with the server profile. And on the client, /var/ossec/bin/agent-auth is installed as a part of the agent profile.
The ossec-authd file is a simple daemon that has a single configurable option and the port to use, which is specified on the command line via the -p option (the default is 1515):
$ sudo /var/ossec/bin/ossec-authd -p 1515
You may also need to create the SSL keys for ossec-authd. To do so:
$ openssl genrsa -out /var/ossec/etc/sslmanager.key 2048
$ openssl req -new -x509 -key /var/ossec/etc/sslmanager.key\
              -out /var/ossec/etc/sslmanager.cert -days 365
On the client, we use the agent-auth command to request a key from the OSSEC server. The -m option manages the keys and the OSSEC server in our example. The -A option is the agent name, which defaults to the hostname (as does our example):
$ sudo /var/ossec/bin/agent-auth -m 192.168.0.1 -A $(hostname)
If this is successful, you should be able to view the contents of the client file:
$ sudo cat /var/ossec/etc/client.keys
Tip
Downloading the example code
You can download the example code files for all Packt books you have purchased from your account at http://www.packtpub.com. If you purchased this book elsewhere, you can visit http://www.packtpub.com/support and register to have the files e-mailed directly to you.
So we have a running OSSEC server. It's configured to send us e-mails with alerts and we're getting a lot of e-mails. Not every alert is actionable or interesting in our environment. We can fine-tune alerts by overriding, supplementing, and enhancing the base rule set with our rules/local_rules.xml file.
By leveraging OSSEC's rules, we can tune rules based on the username, IP address, source hostname, URL, filename, time of the day, day of the week, rules matched, frequency, and time since last alert. The rules provide a powerful way to tweak the alerts we receive and are a great starting point for customization as no coding is required.
Before we start writing rules, we should be aware of some rules to be followed:
The first rule of writing custom rules is to never modify the existing rule files in the
/var/ossec/rulesdirectory exceptlocal_rules.xml. Changes to those rules may modify the behavior of entire chains of rules and complicate troubleshooting.The second rule of writing custom rules is to use IDs above
100000as IDs below it are reserved. Interfering with those IDs is the same as tampering with the distributed rules files themselves. You risk an update of OSSEC clobbering all your hard work.The third rule is to maintain order in your rules. As the rules parser is loading the rules at startup, it validates the existence of referenced rules and groups. If you reference a rule that hasn't been loaded, the parser will fail.
Minding these three rules helps to ensure that our installations won't break with upgrades and that we can always get back to a "stock" OSSEC by removing the local_rules.xml file from our configuration.
Every rule must have an ID, a level, a description, and a match condition. The IDs must be unique, and our rules must have an ID over 100000. It's important to note that re-using or reordering rule IDs can cause confusion or inaccuracy in historic data.
Rules in OSSEC have a level from 0 to 15. The higher the level, more certain the analyzer is of an attack. Level 0 is a special level to tell OSSEC to ignore the alerts where no log will be generated and OSSEC will discard the alert and data silently. By default, OSSEC considers anything at or exceeding level 7 to be e-mail worthy, but it is also configurable.
Rules also require a description field to explain what the rule does. This description will be used as the event identifier in the e-mails and log messages that OSSEC generates. As it will be a part of the reporting, it's best to explain the rule professionally and format it consistently. Descriptions like "alerting for this thing" won't be helpful to your colleagues, whereas "Ignore failed login attempts from vulnerability scanners between 4:00 and 7:00" will be clear and informative.
Now that we're well versed with the protocols of the rules, let's process some data from our custom application logging via syslog as follows:
May 4 19:12:03 server custom-app: Startup initiated.
May 4 19:12:07 server custom-app: No error detected during startup!
May 4 19:12:08 server custom-app: Startup completed, processing data.
May 4 19:12:08 server custom-app: Failed login from '4.5.6.7' as testuser
We're receiving an alert about unknown errors and authentication failures from our custom application. We would prefer to silence these unknown error messages and ensure that we don't provide alerts for failed logins from 4.5.6.7, our vulnerability scanner.
In order to figure out the first step, we need to understand what's happening to generate the alerts:
Use the
ossec-logtesttool provided by OSSEC. It works by accepting log messages onSTDIN(your terminal input) and explaining the path through the rules. Here's how we can run it:$ sudo /var/ossec/bin/ossec-logtestThen we can paste in log lines to see which ones are generating alerts:
ossec-testrule: Type one log per line.

May  4 19:12:03 server custom-app: Startup initiated.

**Phase 1: Completed pre-decoding.
     full event: 'May  4 19:12:03 server custom-app: Startup initiated.'
     hostname: 'server'
     program_name: 'custom-app'
     log: 'Startup initiated.'

**Phase 2: Completed decoding.
     No decoder matched.
The first log message completed the parsing of the line and no alert was generated. So we try the next log message:
**Phase 1: Completed pre-decoding.
     full event: 'May  4 19:12:07 server custom-app: No error detected during startup!'
     hostname: 'server'
     program_name: 'custom-app'
     log: 'No error detected during startup!'

**Phase 2: Completed decoding.
     No decoder matched.

**Phase 3: Completed filtering (rules).
     Rule id: '1002'
     Level: '2'
     Description: 'Unknown problem somewhere in the system.'
**Alert to be generated.
We can see from this output that our unknown problem is being generated by this log line. We get the rule ID and the level being generated and using this information, we can write a rule to ignore it using OSSEC's
level="0".<!-- Local Rules for Example.com --> <group name="local,syslog,"> <rule id="100000" level="0"> <if_sid>1002</if_sid> <program_name>custom-app</program_name> <description>Ignore errors for custom-app</description> </rule> </group>Once we've saved the
local_rules.xmlfile, we can restartossec-logtestand try the event again:**Phase 3: Completed filtering (rules). Rule id: '100000' Level: '0' Description: 'Ignore unknown errors for custom-app'
Now that we've moved this event to level
0, we can look at the failed login events:May 4 19:12:08 server custom-app: Failed login from '4.5.6.7' as testuser' **Phase 3: Completed filtering (rules). Rule id: '2501' Level: '5' Description: 'User authentication failure.' **Alert to be generated.
We'll use a simple match with this data to silence this alert from
4.5.6.7:<rule id="100001" level="0"> <if_sid>2501</if_sid> <program_name>custom-app</program_name> <match>4.5.6.7</match> <description>Ignore failed logins from scanner</description> </rule>
And now re-running
ossec-logtest, we see:May 4 19:12:08 server custom-app: Failed login from '4.5.6.7' as testuser' **Phase 3: Completed filtering (rules). Rule id: '100001' Level: '1' Description: 'Ignore failed logins from our security scanner' **Alert to be generated.
Using these two rules, we've been able to silence the noisiest log entries in our sample environment.
OSSEC rules are processed sequentially. Each rule has a number of conditions and a logical AND is applied to the conditions. The more specific we make the rule, the more accurate it will be. In our example, we filtered events using the program_name attribute for the string, custom-app.
Each rule also specifies an if_sid element, which requires the log message to be flagged with the rule ID we specify. The if_sid parameter can take a comma-separated list of rule IDs, where the rule will match if any of those IDs are matched. Consider that multiple instances of the same element appear in a rule; refer to the following example:
<match>illegal user</match>
<match>unknown user</match>
<match>invalid user</match>
That grouping is surrounded in logical OR. It's important to note that after our rules match, the ID is changed and other rules looking for those lines with the same if_sid parameter, which was originally set, will fail to match. When a new rule matches, it replaces the attributes of the alert with its own values, replacing the ID and level.
While our first rule stopped at eliminating the match based on the rule ID and program name only, the second rule used the match attribute to find a string in the log message itself. In addition to match, there is also a regex attribute to allow more flexible matching of strings.
To see a complete list of fields available, check out the OSSEC documentation on rules' syntax available at the following link:
OSSEC rules are quite capable. We saw how to modify an alert based on the if_sid parameter, which is the rule ID. We saw that we can adjust the rule level using the level of the new rule. Most cases will involve this type of rule-level promotion or demotion depending on the context. We can evaluate events based on a number of fields. We used ossec-logtest to see some of those fields, but we're missing data. In our examples, we saw the following message:
**Phase 2: Completed decoding.
       No decoder matched.
Without a decoder, our event data is limited to simple string matches. Let's take a look at what decoders are and how they work.
Our custom application does not have a valid decoder because we didn't build one. Not every program needs a decoder and we were able to be effective without it. Decoders provide a way to extract field data from the message to be used in context, but not every rule needs a decoder. We saw some of these fields in the pre-decoding phase where common data are extracted:
**Phase 1: Completed pre-decoding.
     full event: 'May  4 19:12:08 server custom-app: Failed login from '1.2.3.4' as testuser''
     hostname: 'server'
     program_name: 'custom-app'
     log: 'Failed login from '1.2.3.4' as 'testuser'
In our rule, we even used the program_name attribute to match our custom application from the log stream.
OSSEC ships with an array of decoders out of the box, consider the output of this default install using ossec-logtest to read an SSH log message:
May  4 19:11:01 ether sshd[3747]: Accepted publickey for brad from 1.2.3.4 port 48801 ssh2

**Phase 1: Completed pre-decoding.
     full event: 'May  4 19:11:01 ether sshd[3747]: Accepted publickey for brad from 1.2.3.4 port 48801 ssh2'
     hostname: 'ether'
     program_name: 'sshd'
     log: 'Accepted publickey for brad from 1.2.3.4 port 48801 ssh2'

**Phase 2: Completed decoding.
     decoder: 'sshd'
     dstuser: 'brad'
     srcip: '1.2.3.4'

**Phase 3: Completed filtering (rules).
     Rule id: '5715'
     Level: '3'
     Description: 'SSHD authentication success.'
**Alert to be generated.
To learn more about decoders, including writing custom decoders, refer to the OSSEC documentation on decoders:
http://www.ossec.net/doc/manual/rules-decoders/create-custom.html
The rules engine tracks its state; it knows what's been happening in the recent past. We can leverage that information to alert or squelch alarms based on frequency of events. The most common example of this is to detect and defend against SSH brute-force password attacks.
This is such a common problem the SSH brute-force detection and active response is built into OSSEC and enabled by default. We're going to take a look at the rules that interact to provide this functionality and provide an explanation of those rules. This will give us insight into how to write something similar for a web application log.
The decoder provides the analyzer with interesting elements out of the log messages, normally using regular expressions. Like the rules engine, the decoder is extensible and configurable. We can easily add decoders for our in-house application logs using the same techniques.
Let's look at a decoder to extract the user and source IP from SSHD log messages involving login failures.
The following snippet comes from OSSEC's default decoders in
/var/ossec/etc/decoders.xml:<decoder name="sshd"> <program_name>^sshd</program_name> </decoder> <decoder name="ssh-invfailed"> <parent>sshd</parent> <prematch>^Failed \S+ for invalid user|^Failed \S+ for illegal user</prematch> <regex offset="after_prematch">from (\S+) port \d+ \w+$</regex> <order>srcip</order> </decoder> <decoder name="ssh-failed"> <parent>sshd</parent> <prematch>^Failed \S+ </prematch> <regex offset="after_prematch">^for (\S+) from (\S+) port \d+ \w+$</regex> <order>user, srcip</order> </decoder> <decoder name="ssh-error"> <parent>sshd</parent> <prematch>^error: PAM: Authentication \w+ </prematch> <regex offset="after_prematch">^for (\S+) from (\S+)$</regex> <order>user, srcip</order> </decoder>
The following rules were selected from the distribution's
rules/sshd_rules.xmlfile:<rule id="5700" level="0" noalert="1"> <decoded_as>sshd</decoded_as> <description>SSHD messages grouped.</description> </rule> <rule id="5716" level="5"> <if_sid>5700</if_sid> <match>^Failed|^error: PAM: Authentication</match> <description>SSHD authentication failed.</description> <group>authentication_failed,</group> </rule> <rule id="5720" level="10" frequency="6"> <if_matched_sid>5716</if_matched_sid> <same_source_ip /> <description>Multiple SSHD authentication failures.</description> <group>authentication_failures,</group> </rule>
Let's examine the interaction between the decoder and rules so we can start using this for our own logs.
Understanding how these messages are processed requires that we understand the path a log entry takes through the OSSEC analyzer. First, let's take a quick look at a flowchart, and then get into the specifics at each step. We'll look at an SSH-failed login message:
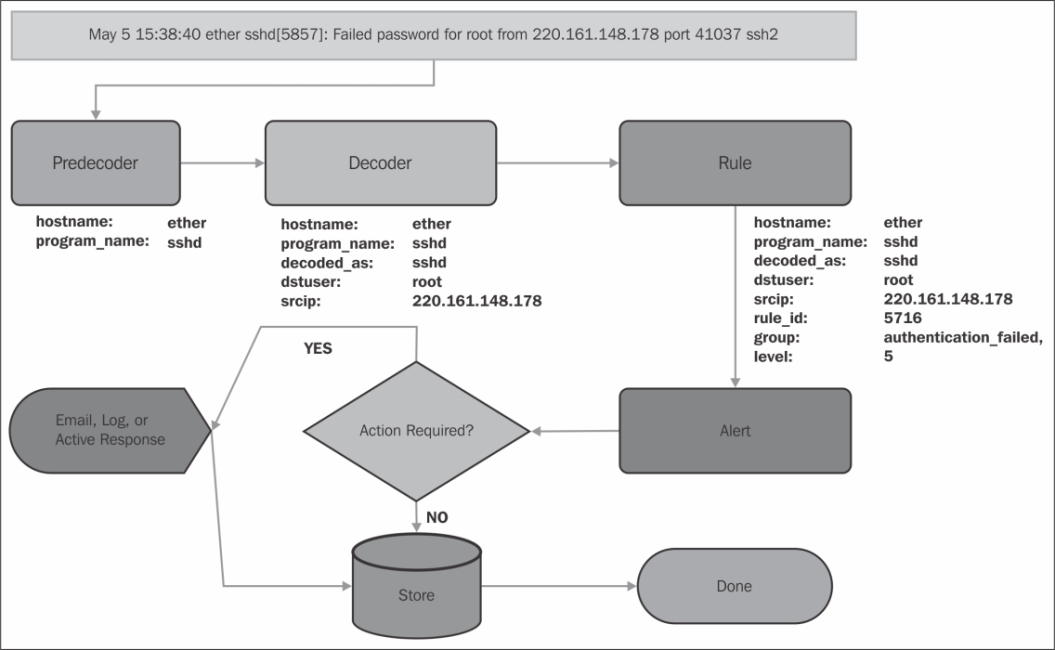
The log message starts by passing through the predecoder to extract the program name, the hostname, timestamp, and deconstructs the log message without the metadata. The next step is to pass through the decoder to add context to the event. The rules are then parsed and a matching rule adds its data to the event and converts it to an alert. If there is an action to be taken (e-mail, log, or active response) for this event, it is dispatched. The details of the event are then tabulated in the OSSEC server for statistical reporting and aggregated analysis. The event has now finished processing. We need to understand how the selected decoders and rules interact to understand how OSSEC can protect our servers from SSH brute-force attacks.
The SSH decoder starts off by anchoring itself to log messages with a program_name attribute starting with sshd. The ssh-invfailed, ssh-failed, and ssh-error decoders all anchor off the parent decoder; they're only loaded and evaluated if the SSHD decoder has matched. Each child rule uses a prematch operative that requires a simple regular expression to match before extraction is attempted.
Once that prematch is satisfied, the regex is called with an offset attribute set to after_prematch. Using this offset attribute, the string after the prematch string is handed to the regex attribute for extraction. Using the offset attribute shortens the string sent to the regular expression, eliminating duplication of matching operations.
For example, using our sample log message:
May 5 15:38:40 ether sshd[5857]: Failed password for root from 220.161.148.178 port 41037 ssh2
After the predecoder extracts the metadata, the decoders process the message as follows:
The
sshddecoder matches theprogram_nameattribute to the valuesshd.The
ssh-invfaileddecoder fails its prematch.The
ssh-faileddecoder succeeds its prematch.The string after the
prematchstring is sent through the decoder for extraction:root from 220.161.148.178 port 41037 ssh2The
regexelement extracts two tokens through the use of grouping parentheses:'root', '220.161.148.178'The
orderelement tells the decoder aboutuserandsrciprespectively.The log message is handed over to the rule engine for analysis as the decoder extracted data.
At this point, OSSEC is building an alert data structure for this message. The decoder uses its output to set the alert data for srcip and user. The decoded_as element is set to the parent of the decoder (sshd here).
The first rule (5700) serves as an anchor for the rest of the SSHD-based alerts. OSSEC uses this rule to form a tree of dependent rules. A parent rule referenced by other related rules helps optimize the path through the rules set. The 5700 rule matches successfully and the alert is set to level 0 and the rule_id attribute is set to 5700.
The rule 5716 anchors to the parent rule using an if_sid attribute with a value 5700. Since our sample message is from SSHD, the rule 5700 has matched and the next condition of the rule 5716 is evaluated. The message is checked to see if it starts with Failed or error: PAM Authentication. If the log entry matches, so that the alert level is updated to 5, the rule_id attribute is updated to 5716 and the group is set to authentication_failed. After this point, no other rules looking for a rule ID of 5700 will match on this message.
The rule 5720 has a frequency attribute set to 6. By setting the frequency, the analyzer will keep tabs on the number of times the rule is triggered in the next 6 minutes. We can use the timeframe attribute to change how long the analyzer tracks the number of times this rule is fired depending on our requirements.
The if_matched_sid attribute checks back 6 minutes to see if the rule_id value 5716 has been triggered 6 times. Remember, the rules are still being evaluated, so even though this rule is currently 5716, there's no guarantee it will stay that way through the rules tree. During the first evaluation, the if_matched_sid attribute checks on the rule_id value 5716 and returns zero results.
We have an additional constraint of this frequency/timeframe attribute to check that the alert is from the same source IP using the same_source_ip attribute. This first message does not match rule_id="5720" this time, but it creates our counter for rule_id="5720" and source IP 220.161.148.178 at 1. Assuming these are the only rules we're using, the rule engine finishes, and an alert with the following data is created:
{
  'srcip'      : '220.161.148.178',
  'rule_id'    : 5716,
  'level'      : 5,
  'dstuser'    : 'root',
  'group'      : 'authentication_failed,',
  'decoded_as' : 'sshd'
}
You may notice that the way the log is parsed it will actually take seven failed login attempts in 6 minutes to trigger the rule_id value 5720. On the seventh failed login attempt from 220.161.148.178, as any user, we'll finally hit the threshold on the rule_id value 5720, and the alert will be rewritten as follows:
{
  'srcip'      : '220.161.148.178',
  'rule_id'    : 5720,
  'level'      : 10,
  'dstuser'    : 'mysql',
  'group'      : 'authentication_failed,authentication_failures,',
  'decoded_as' : 'sshd'
}
The important steps are that the rule_id attribute is replaced, as is the level attribute, and the group attribute has been appended.
The biggest failure of security software is the volume of unactionable alerts. Silencing alerts and investigating false positives robs an organization's valuable hours that it could use to enhance its security posture. OSSEC provides its users with options to fine-tune alerting to keep from becoming the boy who cried "Wolf!".
Armed with knowledge on how to write rules, we could just toggle alerting levels for all rules individually. This would be tedious, unless we used a generic catchall. However, that would destroy the granularity and precision of OSSEC analysis. It would be better to combine the two to maintain granularity and get e-mail alerting down to reasonable levels.
Every rule must set a level. The higher the level, the more severe the alert is considered. Alert levels are integers from 0 (ignore) to 15 (certain high-level security event). The official documentation has the definitive list of levels and their meanings and can be found via the following link:
http://www.ossec.net/doc/manual/rules-decoders/rule-levels.html
Rules can also append groups to the alert metadata. OSSEC ships with a number of defaults, and you're able to create your own. Here are a few interesting groups from the default rule set: invalid_login, authentication_success, authentication_failed, connection_attempt, and attacks.
Using just the level and group of an alert, you can configure a vast amount of alerts in a few lines of configuration.
Perform the following steps to configure alerts:
To do this, start with configuring the default log and the e-mail level for the alerts as follows:
<alerts>
  <log_alert_level>1</log_alert_level>
  <email_alert_level>7</email_alert_level>
</alerts>
To increase the default level to
9, change a single character in theossec.conffile as follows:<alerts> <log_alert_level>1</log_alert_level> <email_alert_level>9</email_alert_level> </alerts>
OSSEC reports feature provides a flexible way to send condensed reports to give you daily insight into alerts that are interesting, though not actionable as individual events. To configure a report of successful logins, add this to your
ossec.conffile:<reports> <category>authentication_success</category> <user type="relation">srcip</user> <title>OSSEC: Authentication Report</title> <email_to>security.alerts@example.com</email_to> </reports>
The e-mail alerting defaults on large networks may inundate administrators in the alerts for the log lines containing the word error. Log level 8 is reserved for first-time events, and you may not want to know the first time every administrator logs into every server in the network. Given that, we can reasonably adjust the level of the e-mail alerts to level 9 that is reserved for Errors from Invalid Sources.
This single-digit change may dramatically improve the volume of the alerts. You may wish to still receive periodic reports on the events not generating e-mails. The use of reports, alerts matching the source IDs, groups, or levels that are specified is summed up and broken down by key elements in the events: usernames, source IPs, event source hosts, levels, and groups.
Our sample report generates a daily report of authentication history for all installed and active OSSEC agents. This happens to be a common requirement for PCI-DSS, SOX, FISMA, or FERPA. The report will contain an aggregation of various categories; here's a sampling of some interesting data:
Report 'OSSEC: Authentication Report' completed.
------------------------------------------------
->Processed alerts: 1293
->Post-filtering alerts: 120
->First alert: 2013 May 10 02:00:02
->Last alert: 2013 May 10 22:05:25

Top entries for 'Source ip':
------------------------------------------------
192.168.0.1                                      |100
127.0.0.1                                        |19
1.2.3.4                                          |1

Top entries for 'Username':
------------------------------------------------
compliance_scanner                               |100
root                                             |19
mallory                                          |1

Related entries for 'Username':
------------------------------------------------
compliance_scanner                               |120
   srcip: '192.168.0.1'
root                                             |19
   srcip: '127.0.0.1'
mallory                                          |1
   srcip: '1.2.3.4'
This report uses the relation attribute to aggregate users by source IP to generate the last stanza of the report. It provides some clarity on the Username and Source ip sections to let us know where particular users originated. Each report requires an email_to attribute to be set to valid.
Another option that is often useful for very specific reports referencing a particular rule, or set of rules, is the showlogs option. Using this option, you can include a complete history of every log message that generated the alerts in the report. This option may generate large e-mails. To use it, add this to your report declaration:
<showlogs>yes</showlogs>
These basic tweaks provide a lot of value, but there are a few additional tweaks we can use to clear up a few noisy alerts and integrate OSSEC with existing security workflows.
Even when toggling the default alert level, you will notice that they occasionally receive alerts below the threshold set in the ossec.conf file. This is because some rules override this setting by explicitly setting the e-mail alert flag. The "bad words" rule, ID 1002, is another example that overrides the default e-mail behavior. The rule is defined as follows:
<!-- Slightly modified for simplicity -->
<rule id="1002" level="2">
  <match>failure|error|attack|bad |illegal|denied|refused|unauthorized</match>
  <options>alert_by_email</options>
  <description>Unknown problem somewhere in the system.</description>
</rule>
This rule uses the alert_by_email option, which always alerts you regardless of the settings of the alert levels. Another set of rules that uses this override detects a restart of the OSSEC process. Rules that detect the start or stop of the OSSEC daemon also use this option to ensure that an e-mail alert is always sent. If you're not interested in these alerts, you can overwrite the rule and change its behavior using the overwrite attribute. This rule should be created in the local_rules.xml file as follows:
<rule id="1002" level="2" overwrite="yes">
  <match>failure|error|attack|bad |illegal|denied|refused|unauthorized</match>
  <options>no_email_alerts</options>
  <description>Unknown problem somewhere on the system (no_email_alert)</description>
</rule>
We need to redefine the rule with our modifications because the overwrite flag replaces the existing rule of that source ID entirely. The purpose of this method in creating a new source ID is so other rules dependent on this rule will not need to also be rewritten to accommodate the change. The downside is that if an improvement to the default rule is made in an OSSEC release, you will need to manually upgrade your local_rules.xml file with that update.
Once at a larger scale, it may become more useful to integrate OSSEC's alert logs into a larger Security Information and Event Manager (SIEM) such as Splunk or ArcSight. Luckily, OSSEC also supports the logging of events via syslog. Any event that OSSEC logs, which is level 1 and above by default, is also written to syslog. OSSEC supports multiple logging formats, including the following:
default: This is the default full syslog output that can be used in hybrid modeCEF: This refers to ArcSight's Common Event Formatsplunk: This is the key-value outputjson: This refers to JSON-encoded events; it is most useful for LogStash or Graylog2
To enable one or more syslog outputs, you just need to declare the server and port values. OSSEC uses UDP for all syslog events as follows:
<syslog_output>
  <server>logserver.example.com</server>
  <port>514</port>
  <format>json</format>
</syslog_output>
This is plain syslog traffic and will not be encrypted. You can change the level for which a certain syslog server receives events by setting the log level in the syslog definition:
<syslog_output>
  <level>10</level>
  <server>critical-events.example.com</server>
  <port>514</port>
  <format>json</format>
</syslog_output>
You can also route certain events by rule group as follows:
<syslog_output>
  <group>authentication_success</group>
  <server>authenticationlogs.example.com</server>
  <port>514</port>
  <format>json</format>
</syslog_output>
Or, you can also route specific events by the source ID directly:
<syslog_output>
  <rule_id>1002</rule_id>
  <server>errors.example.com</server>
  <port>514</port>
  <format>json</format>
</syslog_output>
You may choose to completely disable e-mail alerting from OSSEC and use this syslog mechanism to work within your existing SIEM workflow.
File integrity monitoring (FIM) checks files and directories for changes. A number of commercial and open source solutions are available. OSSEC includes FIM as a part of its comprehensive solution to host-based intrusion detection. We'll briefly explore this feature and how to configure it.
File integrity monitoring looks at those attributes of a file that may indicate that its content has changed. These attributes include size, modification and creation times, one-way hashes of the contents of the file itself, and ownership and permissions of the file. Any change to one or more of these attributes triggers an alert. With OSSEC, we can customize the checks at a system-wide, per-directory, or even per-file level.
We're going to tune the default configuration to monitor additional directories, to always alert on file changes, and to configure the scanning to occur when our systems aren't under heavy load.
Configure the
syschecksection of theossec.conffile as follows:<syscheck> <!-- Alert Enhancements --> <auto_ignore>no</auto_ignore> <alert_new_files>yes</alert_new_files> <!-- Better Scheduling --> <scan_on_start>no</scan_on_start> <scan_time>3am</scan_time> <frequency>82800</frequency> <!-- Directories to check --> <directories check_all="yes" realtime="yes">/etc</directories> <directories check_all="yes">/usr/bin,/usr/sbin</directories> <directories check_all="yes">/bin,/sbin</directories> <directories check_all="yes">/usr/local/bin</directories> <directories check_all="yes" restrict="authorized_keys">/root/.ssh</directories> <!-- Files/directories to ignore --> <ignore>/etc/mtab</ignore> <ignore>/etc/hosts.deny</ignore> <ignore>/etc/mail/statistics</ignore> <ignore>/etc/random-seed</ignore> <ignore>/etc/adjtime</ignore> <ignore>/etc/httpd/logs</ignore> <ignore>/etc/prelink.cache</ignore> </syscheck>
Once you have finished configuring this section, restart OSSEC.
After a few a days of running the default configuration, you may notice that the alarm volume drops off dramatically from the FIM. The default configuration automatically ignores any file that changes beyond the third change, assuming the changes are a part of the normal operation. While this helps with the volume of the alerts, it may not satisfy your compliance requirements. To receive these alerts, we need to disable the auto_ignore feature of syscheck daemon by setting it to no.
When the syscheck daemon detects a new file, it silently creates an entry using this new file's attributes as the baseline. A file's initial state is considered clean and only changes to that state will trigger alerts. If you wish to receive notifications when a file is added to a directory, you may tell OSSEC to notify you by setting alert_new_files to yes.
Now that we have enabled comprehensive alerting on changes to files and directories, we can start to fine-tune the performance of the syscheck daemon. By default, a restart of OSSEC' syscheck daemon starts a scan of all the directories being monitored. This may not be ideal if you need to restart OSSEC for configuration changes in the middle of your peak utilization. To be safe, we disable the startup scan by setting scan_on_start to no.
Now the scans will schedule in accordance with the values defined by our frequency attribute, ignoring daemon restarts. You may have noticed that there has been a possible impact on the performance of this system. Disks just aren't as fast as the rest of our system components. If we're doing scans of directories with a substantially large number and/or size, it's going to impact the performance of the rest of the system. This is true of any FIM solution and not just OSSEC.
To avoid these performance penalties, OSSEC has an option of utilizing the inotify system to check only those files that change. In our directories definition, we set the realtime attribute to yes, and on systems supporting inotify, checks will automatically run when the file or directory is updated.
This means we can relax our scanner further and schedule the full scan to run at a low usage time during the day. We configured syscheck to start scans at 3 A.M., after a minimum of 23 hours (82,800 seconds) since the last scan. For the /etc, /usr/bin and /usr/sbin directories, we enable the realtime notifications if they are supported on the host system. File modifications in these directories will be scanned as they occur at 3 A.M. everyday. For the remaining directories, the realtime option hasn't been enabled, so they will only be scanned once per day at 3 A.M.
Play with these settings to get adequate coverage without imposing a performance penalty on your network or systems.
Working with the OSSEC FIM implementation is nice given how flexible it is. It even has extended capabilities for Windows and hooks for Linux systems using prelinking.
OSSEC's FIM module also supports the monitoring of the Windows registry. On a Windows systems, you may want to be notified anytime the startup items are changed:
<syscheck>
    <!-- scheduling and directories would go here -->
    <windows_registry>HKEY_LOCAL_MACHINE\System\CurrentControlSet\Services</windows_registry>
    <windows_registry>HKEY_LOCAL_MACHINE\Software\Microsoft\Windows\CurrentVersion\RunServicesOnce</windows_registry>
    <windows_registry>HKEY_LOCAL_MACHINE\Software\Microsoft\Windows\CurrentVersion\RunServices</windows_registry>
   <!-- Repeat for all interesting registry keys -->
</syscheck>
You could also specify a root node to monitor and use it with the registry_ignore declarations to enable more comprehensive monitoring of the Windows registry.
On some Linux systems, prelinking is enabled by default. Prelinking decreases application startup time but makes changes to the binary file. These changes trigger alerts in any FIM solution. To cut down on alerting due to prelinking, OSSEC added the ability to send the binary files through the prelink verification process. This process is expensive, but if you are seeing a high volume of alerts caused by prelinking, you can add this to the syscheck section of your ossec.conf file:
<prefilter_cmd>/usr/sbin/prelink -y</prefilter_cmd>
OSSEC can monitor more than just logfiles; it can also monitor the output of commands. OSSEC can leverage its log analysis engine using rules and decoders to alert when a command outputs a certain string. OSSEC can also leverage its file integrity monitoring facilities to alert when the output of a command changes from the previous run. We'll look at a few examples where this might be useful.
OSSEC treats command output as log entries. OSSEC has two options for command monitoring: command and full_command. The difference is how OSSEC handles the output. When using the command variation, every line of output is treated as an individual log entry and analyzed independently. When using the full_command variation, the entire output is regarded as a single log entry.
OSSEC's internal rules match the command output using the source ID 530 and prefix each log entry with the alias or command that is run as follows:
ossec: output: 'df -h' ...
ossec: output: 'my-command-alias' ...
We'll use this knowledge to write rules to handle the output of two commands: one to monitor changes to listening ports with netstat and another to monitor disk usage with df.
To enable command monitoring in OSSEC, configure the commands as
localfileentries in theossec.conffile:<!-- Commands to Monitor --> <localfile> <log_format>command</log_format> <command>df -l -x tmpfs |grep -v '^Filesystem'|awk '{print $1 " mounted as " $6 " usage is " $5 }'</command> <alias>disk-usage</alias> <frequency>3600</frequency> </localfile> <localfile> <log_format>full_command</log_format> <command>netstat -nltu</command> <alias>netstat-listening</alias> <frequency>600</frequency> </localfile>Once the commands are declared, put some rules together in your
local_rules.xmlfile to configure alerting:<rule id="100100" level="2"> <if_sid>530</if_sid> <match>ossec: output: 'disk-usage'</match> <group>system_availability,</group> </rule> <rule id="100101" level="12"> <if_sid>100100</if_sid> <regex>usage is 9\d</regex> <description>Critically high disk usage.</description> </rule> <rule id="100102" level="13"> <if_sid>100100</if_sid> <match>usage is 100</match> <options>alert_by_email</options> <description>Disk is full, availability in jeopardy.</description> </rule>
For the listening ports'
netstatcommand, handle the entire output as a single entity, alerting users in case of any changes:<rule id="100200" level="2"> <if_sid>530</if_sid> <match>ossec: output: 'netstat-listening'</match> <check_diff/> <options>alert_by_email</options> <group>network_services,</group> </rule>
With this rule configured, if the listening ports change, we'll receive an e-mail informing us of the current and previous output of the netstat command.
The commands are defined in the ossec.conf file, similar to logfiles, except they require a command attribute to tell OSSEC what command and arguments to execute. They use the log_format element having value as the command or full_command variation so OSSEC knows how to execute the command and how to handle the output. We're using an alias for these declarations so the rules will be easier to write.
In both our command declarations, we used command pipes, |, to either exclude or format the output of our commands to make alerts more relevant. The df example uses awk to completely rewrite the output of the df command; this makes it easier to read and match using OSSEC's regex/match capabilities. Let's break it down:
df -l -x tmpfs |grep -v '^Filesystem'|awk '{print $1 " mounted as " $6 " usage is " $5 }'
We use the df command to list the capacity and usage of our locally mounted filesystems. We skip the nonlocally mounted filesystems because if an NFS volume fills up, it will alert potentially every server in our infrastructure. We're also excluding the shared memory filesystem, tmpfs. The output of this command on my server is as follows:
$ df -l -x tmpfs Filesystem 1K-blocks Used Available Use% Mounted on /dev/xvda 20421052 9134172 10458508 47% / /dev/xvdc 16513960 7980512 7694588 51% /home
Since we're using the command option, each line is treated as its own log entry. If this is the case, the header to the df command isn't really worth analyzing, so we remove it using grep -v '^Filesystem' to exclude the lines starting with the word 'Filesystem'.
$ df -l -x tmpfs |grep -v '^Filesystem' /dev/xvda 20421052 9134172 10458508 47% / /dev/xvdc 16513960 7980512 7694588 51% /home
The output is usable, but it's not as simple as it could be. So using awk we rewrite each line by printing the first word ($1), " mounted as ", the sixth word ($6), " usage is ", and finally the fifth word ($5). The awk command's defaults interpret the white space as word separators.
$ df -l -x tmpfs |grep -v '^Filesystem'\ > |awk '{print $1 " mounted as " $6 " usage is " $5 }' /dev/xvda mounted as / usage is 47% /dev/xvdc mounted as /home usage is 51%
Using this format, it's easier to write rules and easier for administrators receiving alerts to understand what they mean. We can then start writing rules to notify administrators as follows:
<rule id="100100" level="2"> <if_sid>530</if_sid> <match>ossec: output: 'disk-usage'</match> <group>system_availability,</group> </rule>
The first rule for the disk-usage command anchors the rest of the rules as their parent. It also appends the system_availability group to the alert. We could use this group to route alerts to different e-mails, active responses, or look at aggregates. The next rule that we'll write looks at 90 to 99 percent disk usage:
<rule id="100101" level="12">
<if_sid>100100</if_sid>
<regex>usage is 9\d</regex>
<description>Critically high disk usage.</description>
</rule>This rule will alert a high-importance event at level 12. To match this, the rule anchors to the rule 100100 with the if_sid declaration. The regex element is used to look for usage is 9 followed by the other digit \d—when the usage is 90 to 99 percent. Once the disk goes to 100 percent, this rule will stop matching; so, we'll need another rule to handle this special case:
<rule id="100102" level="13"> <if_sid>100100</if_sid> <match>usage is 100</match> <options>alert_by_email</options> <description>Disk is full, availability in jeopardy.</description> </rule>
This rule again anchors itself to the parent rule, 100100. We can't have a disk at 101 percent usage or higher so we look for 100 percent only. The alert level is raised to 13 (unusual error), and we explicitly set the alert_by_email option so we can be assured that this alert will always generate an e-mail regardless of our other e-mail and report settings.
Our next command monitors the listening of the TCP and UDP ports using netstat.
netstat -nltu
This calls the netstat command with the following options: do not look up hostnames (-n), show only listening sockets (-l), show TCP sockets (-t), and show UDP sockets (-u).
To accomplish our goal, it's not necessary to transform or decode the output of the netstat command. A simple difference between the current and previous run is sufficient. We can achieve this with a single rule:
<rule id="100200" level="2">
  <if_sid>530</if_sid>
  <match>ossec: output: 'netstat-listening'</match>
  <check_diff/>
  <options>alert_by_email</options>
  <group>network_services,</group>
</rule>We check the source ID 530, the source ID for the command output, and the match using the alias for the command netstat-listening. We add the network_services group to the alerts. To check for differences, you need only specify the check_diff attribute to the rule. The alert level is 2 (system information), but we really want to know about these events so we set the alert_by_email flag on the alert.
OSSEC ships with a rootkit detection module that looks specifically for traces of rootkits, malware, and Trojans on configured systems. This recipe looks briefly at configuring the rootcheck module.
The OSSEC syscheck daemon runs the rootkit module. There are a few components of the rootkit detection module, all configurable individually. They are as follows:
File detection: This component looks for malicious files at known locations
/dev check: This component looks in
/devfor executable filesPID check: This component looks for processes hidden from
psPort check: This component looks for open ports hidden from
netstatInterface check: This component looks for an interface in promiscuous mode
System scan: This component looks for anomalies in the filesystem, that is, for bad permissions and strange SUID (set user ID) files
Policy checks: This component looks for weird items in files; its submodules are as follows:
Trojans check: This module looks for well-known Trojans on the system
Windows malware: This module looks for well-known malware
Windows application: This module looks for bad applications
System audit: This module looks for bad configurations that would be a violation of the best practices according to industry standards
Some of these checks, like the interface check, are really simple and quick while others like the policy check can be quite resource intensive.
Here are some guidelines for detecting rootkits and anomalies:
Check OSSEC's default configuration of the
rootcheckdaemon inossec.conf:<rootcheck> <rootkit_files>/var/ossec/etc/shared/rootkit_files.txt</rootkit_files> <rootkit_trojans>/var/ossec/etc/shared/rootkit_trojans.txt</rootkit_trojans> </rootcheck>To completely disable the rootkit module, change the
rootchecksection to the following:<rootcheck> <disabled>yes</disabled> </rootcheck>Disabling the rootkit detection module isn't ideal, but there are some exceptional cases we might need to address. A better configuration for a CPU-bound system is as follows:
  <rootcheck>
     <frequency>172800</frequency>

    <!-- Disable CPU heavy checks due to network connections -->
    <check_ports>no</check_ports>
    <rootkit_files>/var/ossec/etc/shared/rootkit_files.txt</rootkit_files>
    <rootkit_trojans>/var/ossec/etc/shared/rootkit_trojans.txt</rootkit_trojans>
  </rootcheck>
If we had a disk-bound system, it might be wise to disable the intensive disk checks as follows:
  <rootcheck>
    <frequency>172800</frequency>

    <!-- Disable high disk IO Checks -->
    <check_policy>no</check_policy>
    <check_sys>no</check_sys>
    <rootkit_files>/var/ossec/etc/shared/rootkit_files.txt</rootkit_files>
    <rootkit_trojans>/var/ossec/etc/shared/rootkit_trojans.txt</rootkit_trojans>
  </rootcheck>
OSSEC's default configuration enables all the rootkit checks. With the rest of the modules running, we adjust the frequency attribute from the default value of every 20 hours to every 48 hours.
There are a few heavy checks that are enabled depending on your system profiles. On systems that use network filesystems (NFS), the rootcheck daemon may cause performance problems while running checks that read data from the filesystem.
The check_policy attribute actually controls the policy checks, including the trojans, winmalware, winapps, unixaudit, and winaudit checks. These checks inspect the contents of files on the filesystem, looking for misconfiguration. You can disable one or more of these checks individually, but as they scan the same places, it's best to disable the entire set.
The system scan can also lead to high-disk input/output and degrade system performance, though it's very rare. We can disable it by setting check_sys to no in the rootcheck section as we previously saw. This check isn't opening a lot of files but is using the stat system call to look at permissions. You may have guessed that this is more expensive on network filesystems but also on systems with a large number of files.
For systems that have a large number of network connections open at the same time, you may find that the port check component can take a lot of CPU. Port check uses netstat to determine either currently open ports or closed ports with live connections. On systems with several thousand concurrent, open connections, this check can actually impact production performance. You can disable this check by setting check_ports to no in the rootcheck section.
There may be an overlap where you have both a large number of connections as well as network-mounted filesystems. Disabling individual checks is not exclusive, so you can disable as many as you need to get the performance to reasonable levels.
The rootcheck daemon can be configured to do more precise or more sweeping scans.
The rootcheck module uses a file configuration syntax that can and has been extended to provide the system audit capability. It provides a notation for "if this directory contains an executable" and "if this file contains this line". It can audit the configuration of critical services and identify violations of corporate or security policy.
There are some servers that keep administrators up at night. If these systems have resources to spare, you can enable a "paranoid" mode on the rootcheck module. This setting does away with the notion of "look in well-known places for bad things" and enables "look everywhere on the system for bad things". While this sounds spectacular, it is very resource intensive and should be used only where necessary.
To enable the "paranoid" mode, configure the rootcheck module as follows:
<rootcheck>
    <!-- Enable Scanning of ALL THE THINGS! -->
    <scanall>yes</scanall>
     <frequency>86400</frequency>
    <!-- etc, .. -->
</rootcheck>
I recommend setting a custom frequency attribute when you enable scanall, if only to make yourself aware. Use periods that are common to monitoring systems: days, weeks, or months. The default of 20 hours can drive administrators insane trying to track down why the server is under high load at seemingly random times on their graphs.
A standout feature of OSSEC is its active response module. Active response allows commands to be executed based on the triggering of a rule. It provides these commands with network, user, and file information from the rules that tripped the active response. With the active response system, you can provide targeted protection to your network. Using this mechanism, it is possible to implement the functionality of the popular Fail2Ban SSH brute-force protection using OSSEC.
In order to implement active response, you will need to know how active response commands are called. The firewall-drop.sh script ships with OSSEC implementing the locking and logging feature, and also works on most Linux/BSD systems. We'll take a look at an incredibly distilled version of the script to understand how active response works:
#!/bin/sh
#
ACTION=$1
SRCIP=$3

if [ "$ACTION" == "add"]; then
    /usr/sbin/iptables -I FORWARD -s $SRCIP -j DROP
    /usr/sbin/iptables -I INPUT -s $SRCIP -j DROP
elif [ "$ACTION" == "delete"]; then
    /usr/sbin/iptables -D FORWARD -s $SRCIP -j DROP
    /usr/sbin/iptables -D INPUT -s $SRCIP -j DROP
else
    echo "invalid action, specific add or delete";
    exit 1;
fi;
Our distilled firewall-drop.sh script is a simple shell script that receives the arguments starting with $1 from the command-line call. It doesn't implement any error-checking mechanism and assumes the host system is a Linux-based distribution with the iptables binary in /usr/sbin/iptables. It checks the $1 parameter for the action, which will be either add or delete, and executes the iptables commands to add or remove the IP for the appropriate tables.
The trickiest part of the script is knowing what each positional parameter represents. Here's a simple breakdown for Linux/BSD shell scripting:
|
Position |
Shell variable |
Description |
|---|---|---|
|
1 |
|
Action: add or delete |
|
2 |
|
Event: User or hyphen (-) if empty |
|
3 |
|
Event: Source IP or hyphen (-) if empty |
|
4 |
|
Event ID (unique per event) |
|
5 |
|
Event rule ID or source ID |
|
6 |
|
Event information: This may contain the agent name, host, or filename based on the context |
Using these variables, you could create your own active responses to integrate with your existing network and host security infrastructures.
Perform the following steps to introduce the active response module:
OSSEC ships with a few active response commands included. Configure OSSEC with active response and enable the
firewall-dropcommand; you should now have acommandattribute set up in theossec.conffile already, as follows:<command> <name>firewall-drop</name> <executable>firewall-drop.sh</executable> <expect>srcip</expect> <timeout_allowed>yes</timeout_allowed> </command>
To implement the Fail2Ban functionality, configure the active response a bit more than the stock
ossec.conffile:<active-response> <command>firewall-drop</command> <location>local</location> <rules_id>5551,5712,5720,31151</rules_id> <timeout>600</timeout> <repeated_offenders>600,3600,86400</repeated_offenders> </active-response>
When setting up commands, OSSEC is configured to look for the firewall-drop.sh script in the /var/ossec/active-response/bin directory. We declared the command to expect a source IP, so events dispatching this command without a valid source IP will be ignored. A timeout is allowed for active responses that call this command, allowing the pruning of unnecessary firewall rules by setting timeout_allowed to yes.
We add an active-response element to run the firewall-drop command. The location in this case is the local agent generating the alarm, but we could simply say "all" or specify a specific agent ID where the command needs to be run.
Adding and deleting firewall rules from production systems should be something that's very deliberate and specific. We configure the response to be fired on the following rules: 5551, 5712, 5720, and 31151. This is a selection of rules that indicates SSH brute-force probes/attacks. This is much more predictable than using groups or levels as sources of events.
A timeout value of 600 seconds is set for this active response. When this active response fires the first time, the script will be called with the action parameter set to add. Ten minutes later, OSSEC will re-run the script with the same parameters, only this time modifying the action parameter to delete.
Using the repeat_offenders parameter, we can adjust this timeout based on how frequently a particular source IP trips this active response. The first two timeouts are 10 minutes, the third time that the same IP trips the alert it moves into blocking mode for an hour, and for the fourth and for all subsequent times, the IP is blocked for 24 hours.
Active response can be configured to run anywhere on the network, so there's really no limit to how interesting your responses can be. There's also nothing preventing you from leveraging the active response system to assist you in tracking events. You could easily create a simple shell script to integrate OSSEC alerting directly into a ticketing system, such as JIRA, RTIR, or Remedy.
As a deployment of OSSEC expands and matures, so does the volume of alerts. Normal activities, such as system packages updates, updates to critical configuration files, and users' interaction with those systems, generate alerts. This section will explore the possibility of using active response to assist with the verification of changes to a user's list of scheduled tasks (crontab).
Shortly after enabling OSSEC on my network, I began receiving alerts for "normal" changes to the environment. Our configuration management software, Puppet, was generating alerts by updating the crontab of the root user. When Puppet manages a user's crontab, it prepends a header to the file as follows:
# HEADER: This file was autogenerated at 2013-03-01 13:30:53 +0100 by puppet.
Implementing a script to check Puppet's modification time against the crontab modification time isn't difficult. We just need to know how to leverage the entire OSSEC infrastructure.
Unfortunately, OSSEC does not provide a decoder to extract fields from crontab log messages. Luckily, we can easily extend the decoders! We'll add a small decoder to handle crontab messages and extract the username.
To verify alerts with active response, perform the following steps:
Set up decoders for our crontab log entries and our new logging target
ossec-ar-verify. Then place them in the/var/ossec/etc/decoders.ddirectory and tell OSSEC to look there for our custom decoders. Also, add thecommandandactive-responseelements to theossec.conffiles:<command> <name>ossec-ar-verify-crontab</name> <executable>ossec-ar-verify-crontab.sh</executable> <expect>username</expect> <timeout_allowed>no</timeout_allowed> </command> <active-response> <command>ossec-ar-verify-crontab</command> <location>local</location> <rules_id>106001</rules_id> </active-response> <rules> <!-- OSSEC Decoders --> <decoder>etc/decoder.xml</decoder> <!-- Load my custom decoders --> <decoder_dir>etc/decoders.d</decoder_dir> <!-- Rest of rules --> </rules>Next, set up the
crontab.xmldecoder:<decoder name="crontab"> <program_name>crontab</program_name> </decoder> <decoder name="crontab-user"> <parent>crontab</parent> <regex>^\((\S+)\) </regex> <order>user</order> </decoder>
After that, set up the
ossec-ar-verify.xmldecoder:<decoder name="ossec-ar-verify"> <program_name>ossec-ar-verify</program_name> </decoder> <decoder name="ossec-ar-verify-crontab"> <parent>ossec-ar-verify</parent> <prematch>^crontab </prematch> <regex offset="after_prematch">^(\S+)</regex> <order>user</order> </decoder>
Then define the rules to handle the triggering of the active response and then interpret the results in our
local_rules.xmlfile:<rule id="106001" level="1"> <if_sid>2833</if_sid> <options>no_email_alert</options> <description>Verify the crontab modification</description> </rule> <rule id="107000" level="11"> <decoded_as>ossec-ar-verify</decoded_as> <description>OSSEC ActiveResponse Verification</description> <group>verified,</group> </rule> <rule id="107001" level="12"> <if_sid>107000</if_sid> <match>^crontab </match> <options>alert_by_email</options> <description>Verified: Crontab changed outside of Puppet</description> <group>oob_change,scheduled_tasks</group> </rule>Also, distribute a Perl script to handle your date math with a wrapper shell script. The wrapper script
ossec-ar-verify.shreferenced in our command declaration is as follows:#!/bin/sh USER=$2 CRONTAB="/var/spool/cron/$USER" if [ -f "$CRONTAB" ]; then /usr/local/bin/ossec-ar-verify-crontab.pl $CRONTAB rc=$? if [ "$rc" != "0" ]; then logger -t ossec-ar-verify "crontab $USER change outside Puppet" fi fi
OSSEC includes the rule 2833 to identify when the root's crontab changes. We need to take action on this alert and generate another more serious alert if the validation against Puppet fails. The steps to verify the alert are as follows:
If the rule
2833fires, silence it.Run an active response command on the agent generating the alert.
If validation fails, inform OSSEC via syslog.
OSSEC should understand the new notification and alert via e-mail.
For step 1, rule 2833 uses the alert_by_email option to always send an e-mail regardless of the level of the alert. Since we're going to be verifying this alert, we need to disable that e-mail. The best way to do this is to create a new rule (100601) in our local_rules.xml file to turn off the e-mail alert.
To enable the active response required in step 2, we need three things: a script to run, a command declaration in the ossec.conf file, and an active-response declaration in ossec.conf. In simple words, the script we're calling is a wrapper around another script that checks the file modification time of the crontab file against the date of the header provided by Puppet. If they vary by more than 1 minute, the script exits with an error; if the times match, the script exits successfully. Our wrapper script uses these exit codes to determine whether or not to generate a new syslog message by calling the logger program. If the dates match, no message is generated; if they don't, the following command is called:
logger -t ossec-ar-verify "crontab root changed outside puppet"
This may be the first of many verification scripts, so we create a namespace for this purpose; ossec-ar-verify is descriptive and succinct. We name this command ossec-ar-verify-crontab with an absolute path of /var/ossec/active-response/bin/ossec-ar-verify-crontab.sh. This script requires a username to be set so we know whose crontab to verify. Since it's only being run once per alert, there's no need to use the timeout features; so we've disabled them. Next we have to configure the active-response element to use this command.
We created a child of rule 2833, and the source ID of that new rule is 106001. This script needs to be run at the source of the event, so we configure the location of this active response to be local. The command variation is set to ossec-ar-verify-crontab.
We need events to pass a username to the active response, but OSSEC doesn't ship with a decoder for crontab log messages. Without it, our active response would never fire and we'd silently discard all these messages. We create a crontab.xml decoder file and place it in the /var/ossec/etc/decoder.d directory we configured to be loaded in the ossec.conf file. This decoder extracts the username from the crontab log messages to pass to the active response.
For step 3, we're going to simply send a new log message via syslog if the verification fails, which will look similar to the following:
Jun 2 12:57:38 host ossec-ar-verify[640]: crontab changed outside Puppet
We create an ossec-ar-verify.xml file in our /var/ossec/etc/decoder.d directory to extract fields from messages to our new syslog target ossec-ar-verify. The decoder parent will be named ossec-ar-verify, so we can use the high-speed decoded_as attribute for anchoring rules.
The two decoders work together to set the decoded_as attribute in the event and extract the user attribute from the crontab alerts. The regex attribute in our second decoder line extracts the first word after the prematch element (crontab in our example). The order element assigns names to the variable extracted using grouping parentheses. We're only extracting a single value named user.
If the modification times don't match, step 4 of our model is triggered by our log messages. We create a rule 107000 to anchor any current and future ossec-ar-verify messages; this rule also appends a verified group to the alert that we can use for reporting. The rule 107001 matches messages starting with the word crontab. It sets the alert_by_email option to notify the administrators. It also appends the oob_change (out of band change) and scheduled_tasks groups to the alert for reporting.
Hopefully, this example will make you wonder, "Couldn't I extend this same pattern to verify file checksum changes against our package manager and/or configuration engine?". Yes! Given the scriptability of the active response system, you are not limited by vendor lock-in and can incorporate data sources for verification from anywhere in your organization. You are limited only by your own creativity!
