Going Ahead with vRealize Operations
vRealize Operations Manager 6.6 is a solution from VMware to help customers monitor, troubleshoot, and manage the health, capacity, and compliance of their virtual environment.
Throughout this book, I may occasionally refer to vRealize Operations as vROps. vROps is not an official VMware acronym or name for the vRealize Operations product.
The vRealize Operations 6.6 release offers a combined experience with VMware vRealize Business for Cloud and VMware vRealize Log Insight, delivering a complete intelligent operations solution that is designed to help customers plan, manage, and scale their Software-Defined Data Center (SDDC)and multi-cloud environments to meet business needs.
As we said, vRealize Operations is, first of all, a monitoring solution. But what does monitoring mean? In a traditional sense, monitoring can be defined as observing the current, real-time behavior of any system to make sure that it runs as expected, or well within the defined boundaries. It helps answer questions that are faced by IT on a day-to-day basis. Be it the IT or cloud administrators who manage the IT systems and infrastructure, the application owners monitoring their critical application stacks, or the executives who are responsible for making strategic decisions around capacity and growth, the latest release of vRealize Operations caters to all the personas with multiple use cases out of the box. For future reference, in this book, we will combine all of these personas, or anybody else using vRealize Operations, under the name virtual infrastructure admins, or vAdmins.
By that definition, vRealize Operations is not a monitoring solution. It does not monitor and gather data in real time as, for example, a typical performance monitoring tool would gather real-time resource (CPU, memory, disk I/O, and so on) utilization information from a system. Although we may refer to it as a monitoring solution throughout the book, make sure to differentiate it from a typical real-time monitoring solution. vRealize Operations is more of a historical analytics and forensics tool that uses predictive analytics and dynamic thresholding to show vAdmins not only what is currently (again, not actual real time, as we will see later in the book) wrong in their environment, but what will go wrong in the future.
Moreover, the predictive analysis engine feature also allows vAdmins to run capacity plans on their environments, ensuring that there are always enough resources to run mission-critical workloads without stress. VMware provides out-of-the-box dashboards and reports to quickly view key predictive analysis features, as well as health and performance metrics.
vRealize Operations is a great tool for vAdmins to gather historical analytics and forensics data from their VMware environments, and do predictive analytics based on that data. But its greatness doesn’t stop there. The need for vAdmins to be able to gain visibility into other environments and applications gave birth to the vRealize Operations adapters and management packs to enable communication to those monitored endpoints.
Some of these management packs further extend the monitoring capabilities of vRealize Operations into the VMware product ecosystem.
For example, the Management Pack™ for vRealize Automation™ extends the operational management capabilities of the vRealize Operations platform to provide tenant-aware operational visibility of the infrastructure supporting private clouds to cloud provider administrators.
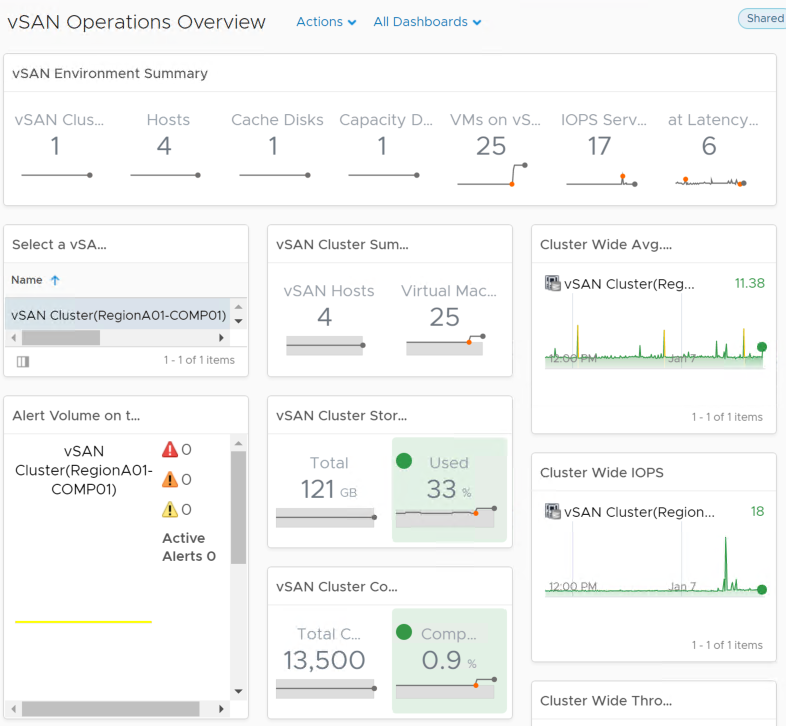
With the vRealize Operations Management Pack for vSAN™ installed, you can make vSAN operational in a production environment. You use dashboards provided with the solution to evaluate, manage, and optimize the performance of vSAN objects and vSAN-enabled objects in your vCenter Server system.
Other management packs extend into third-party products and hardware vendors.
The Oracle Enterprise Manager Management Pack for vRealize Operations allows the VMware admin to see Oracle metrics side by side with the VMware metrics, allowing for quick diagnosis of the root problem.
There are a number of management packs available to the vAdmin to help gain this visibility, and ensure there are no hardware failures of the underlying hardware infrastructure. These management packs range from EMC and Trend Micro to Dell, NetApp (from Blue Medora ), and Hewlett-Packard.
A compatibility guide and a list of recent updates in the management packs can be found at https://www.vmware.com/resources/compatibility/pdf/vi_vrops_guide.pdf.
In this chapter, we will cover the following topics:
- Return on investment (ROI) with vRealize Operations
- What vRealize Operations can do
- Key component architecture
- Node types and their purpose
- High availability (HA) and scalability
ROI with vRealize Operations
There is a lot of promise in the Internet of Things (IoT) as a means to create business value, but there is also a lot of hype. In fact, an unclear business benefit is one of the top barriers to IoT efforts overall.
Why do we make business investments?
The short answer is, we make business investments because, after all, this is the cost of doing business. This is the cost you have to pay to be able to stay in business.
How do we stay in business?
By making smart decisions guided by intelligent and reliable information. The main drivers that affect the ability to stay in business are the following:
- Reducing costs
- Improving price-to-performance ratios
- Lowering risk, or in other words, increasing the change to avoid failures that can lead to catastrophic costs for the business
As IT leaders continue to struggle with translating value into business terms, they need a simple language with relevant and reliable metrics to not only be able to stay in business, but also to grow the business by increasing business revenue growth and enhancing products, services, and experiences for customers. And for those who are looking for new market and product horizons, this will help you transform your business and stay competitive, or even become a market leader.
What tools do we need to stay in business?
In the IT world, it really helps to achieve those business goals by helping out your IT by giving the infrastructure and application teams the tools that will enable them to perform:
- Application-aware monitoring: Accelerate time to value, and troubleshoot smarter with native integrations, unified visibility from applications to infrastructure health, and actionable insights combining metrics and logs.
- Automated and proactive workload management: Simplify and streamline operations with the fully automated management of infrastructure and applications performance, while retaining full control. Automatically balance workloads, avoid contention and enable proactive detection and automatic remediation of issues and anomalies before end users are impacted.
- Capacity planning and optimization: Optimize cost and resource usage through capacity management, reclamation, and right-sizing, improve planning and forecasting, and enforce IT and configuration standards.
The VMware vRealize Operations product portfolio provides the necessary functionality to satisfy the above use cases. It delivers a complete intelligent operations solution that is designed to help customers plan, manage, and scale their SDDC and multi-cloud environments to meet business needs.
VMware commissioned Forrester Consulting to conduct a Total Economic Impact (TEI) study, and examine the potential ROI enterprises may realize when deploying intelligent operations solution. Working with four VMware customers, Forrester identified and quantified the key benefits of investing in this intelligent operations solution, including the following:
- A 20% improvement in operational efficiency
- Over 10% savings in hardware costs
- A 75% reduction in unplanned downtime
The TEI study demonstrates quantifiable ROI of 119%, a payback period of 3 months, and $1.4M NPV over 3 years.
If you would like to estimate the potential 3-year cost savings and benefits of deploying and using the tools included in this intelligent operations solution, use the vRealize Intelligent Operations Estimator Tool at https://tools.totaleconomicimpact.com/go/vmware/vrops/.
What can vRealize Operations do?
vRealize Operations collects data from objects in your environment. Each piece of data collected is called a metric observation, or value. Metrics can be grouped together in a vRealize Operations view.
Views are resource-type-specific, self-contained, reusable displays of information.
You have to define the resource type (or types) that you want to use as the "subjects" for the view. This is necessary so that you can select metrics that are specific to a resource type.
A view configuration is entirely independent of other views or settings. A view will display exactly the same everywhere it is used.
Due to their self-contained nature, and thanks to extensive integration points provided throughout vRealize Operations, views can be reused extensively. You can create valuable vRealize Operations views, and reuse them for every table or chart.
You can configure views to show transformation, trend, and forecast calculations:
- The transformation type determines how the values are aggregated.
- The trend option shows how the values tend to change, based on the historical raw data. The trend calculations depend on the transformation type and roll-up interval.
- The forecast option shows what the future values can be, based on the trend calculations of the historical data.
vRealize Operations provides several types of views. Each type of view helps you to interpret metrics, properties, policies of various monitored objects including alerts, symptoms, and so on, from a different perspective.
Views can be added to dashboards via the view widget. Dashboards present a visual overview of the performance and state of objects in your virtual infrastructure. You use dashboards to determine the nature and time frame of existing and potential issues with your environment.
Views are also the building blocks for reports. A report captures details related to current or predicted resource needs.
Used separately, or in reports, or dashboards, views can increase ROI in multiple ways.
Standalone views let you package up multiple key performance metrics into one view, removing the repetitive task of digging through metric menus. They are available for both parent and children resources, enabling you to quickly get key information for resources up and down the stack.
When used in reports, views increase your vRealize Operations ROI by combining vital configuration and performance information across your stack in a simple and reusable package. Report execution and delivery can also be automated, saving you even more time!
When used in dashboards, views allow you to define your resource KPIs in one place (the view), then reuse it elsewhere (reports and dashboards).
vRealize Operations has come a long way in recent years, but the more interesting and exciting features have come in the latest releases of the product. Here is a short overview of the new and enhanced features in the latest release of vRealize Operations, 6.6.
vRealize Operations offers simplified usability and faster time-to-value capabilities, as follows:
- A new HTML5 user interface provides an easier and consistent experience. The new UI is clarity-based, which is a standard used by all the products of VMware. This allows you to seamlessly go from one area of the solution to another, whether it is metrics, logs, or cost, without learning the menus or impacting your user experience.
- Consolidation and simpler grouping of menus, leading to the enhanced user experience.
- The Getting Started dashboard allows for quick navigation.
- Persona-based dashboards provide answers in one place. Dashboards are separated into categories such as Operations, Capacity and Utilization, Performance Troubleshooting, Workload Balance, and Configuration and Compliance.
- Out-of-the-box integration with vSAN, vRealize Log Insight, vRealize Business for Cloud, and vRealize Automation provides quick time to value:

It is optimized for SDDC management:
- Native vSAN management capabilities allow for centralized management across vSAN stretched clusters
- Ability for complete vSAN management, which includes administering performance, capacity, logs, and configuration and health
- Deploy vSAN with confidence with complete visibility down to disk level
- Operationalize vSAN with performance and capacity monitoring, including deduplication and compression benefits:
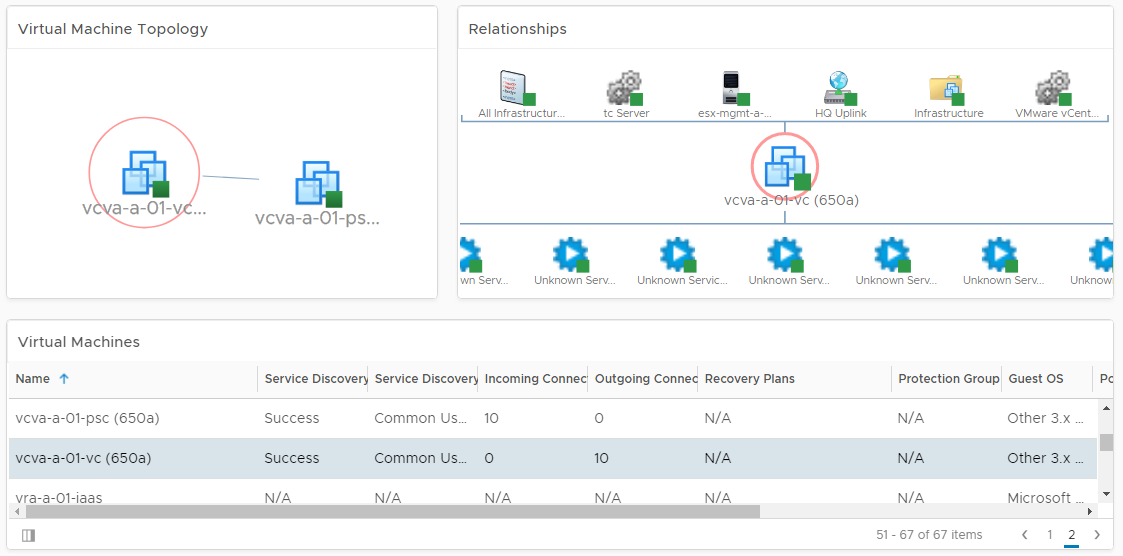
The Service Discovery Management Pack discovers all the services running in each VM and then builds a relationship or dependencies between services from different VMs, based on the network communication. The management pack can create dynamic applications based on the network communication between the services:
It has intelligent workload placement featuring fully automated workload balancing:
- Ensures performance across data centers with fully automated workload balancing, across clusters and across data stores (with storage vMotion)
- Ensures DRS configurations, and provides the option to set DRS automation level for individual objects
- Predictive DRS takes action to pre-empt resource contention
- Utilizes operations analytics to optimize initial placement of workloads through vRealize Automation:

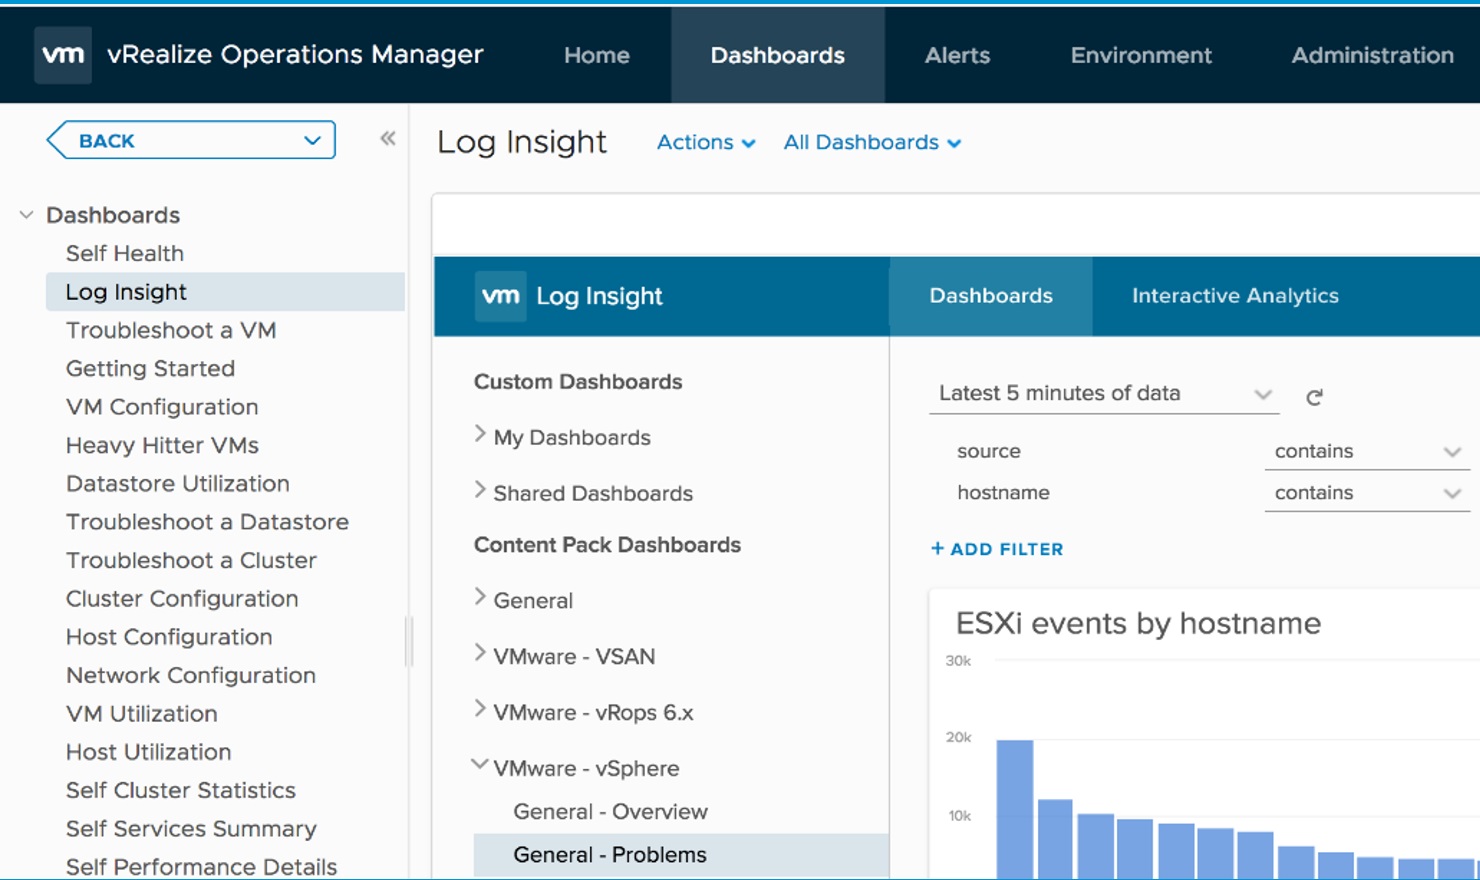
It has log integration:
- Full integration in-context within vRealize Operations for faster troubleshooting:
- Direct launch of the Log Insight dashboard
- Direct launch into Log Insight Interactive Analytics mode
- Object auto-initiated log management
- vRealize Operations alerts auto-initiated log management:
It enables cost management:
- Optimize public cloud spending with more visibility:
- Cost visibility: Costing analysis for all services on AWS and Azure
- Usage visibility: VM level usage visibility into public clouds
- Enhanced planning by correlating capacity and costs:
- Fine-grained cost analysis for private cloud
- Makes capacity optimization quantifiable
- Procurement planning
It has the following additional out-of-the-box compliance and hardening capabilities:
- Ability to tackle compliance problems through the new vSphere hardening dashboard
- Extends compliance through PCI and HIPAA compliance for vSphere
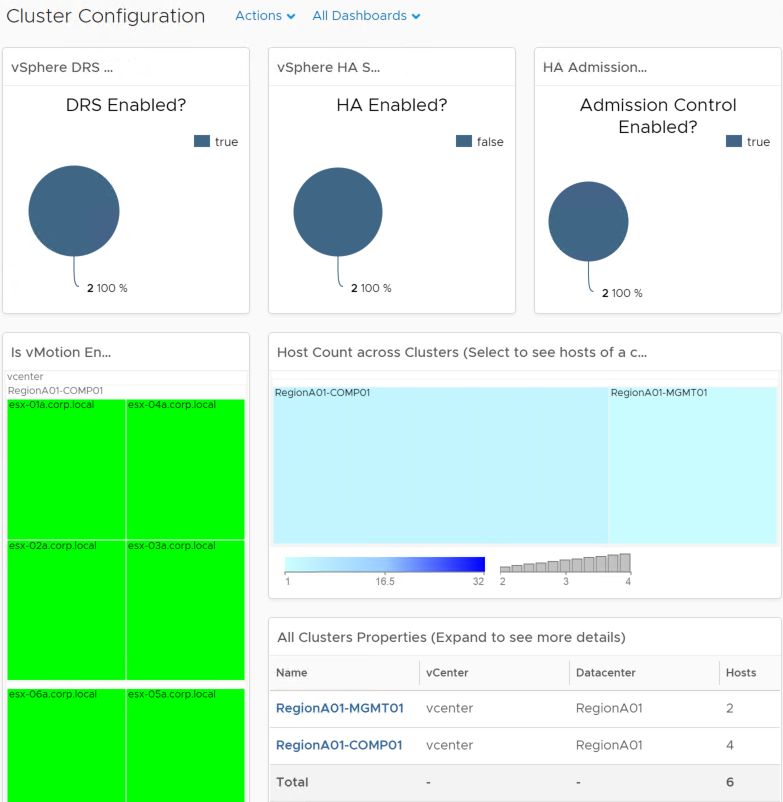
- Ensures business configurations through new cluster, host, and VM configuration dashboards:
It has sizing and scalability enhancements:
- You can now scale to six extra large nodes in a cluster, which can support up to 180,000 objects, and 45 million metrics
- You can now monitor up to 60 vCenter servers with a single instance of vRealize Operations
- A large remote Collector can support up to 15,000 objects
vRealize Operations key component architecture
In vRealize Operations 6.0, a new platform design was introduced to meet some of the required goals that VMware envisaged for the product. These included the following:
- The ability to treat all solutions equally, and to be able to offer management of performance, capacity, configuration, and compliance to both VMware and third-party solutions
- Provide a single platform that can scale to tens of thousands of objects and millions of metrics by scaling out with little reconfiguration or redesign required
- Support a monitoring solution that can be highly available, and support the loss of a node without impacting the ability to store or query information
With that new common platform, the design came a completely new architecture.
The following diagram shows the major components of the vRealize Operations 6.6 architecture:
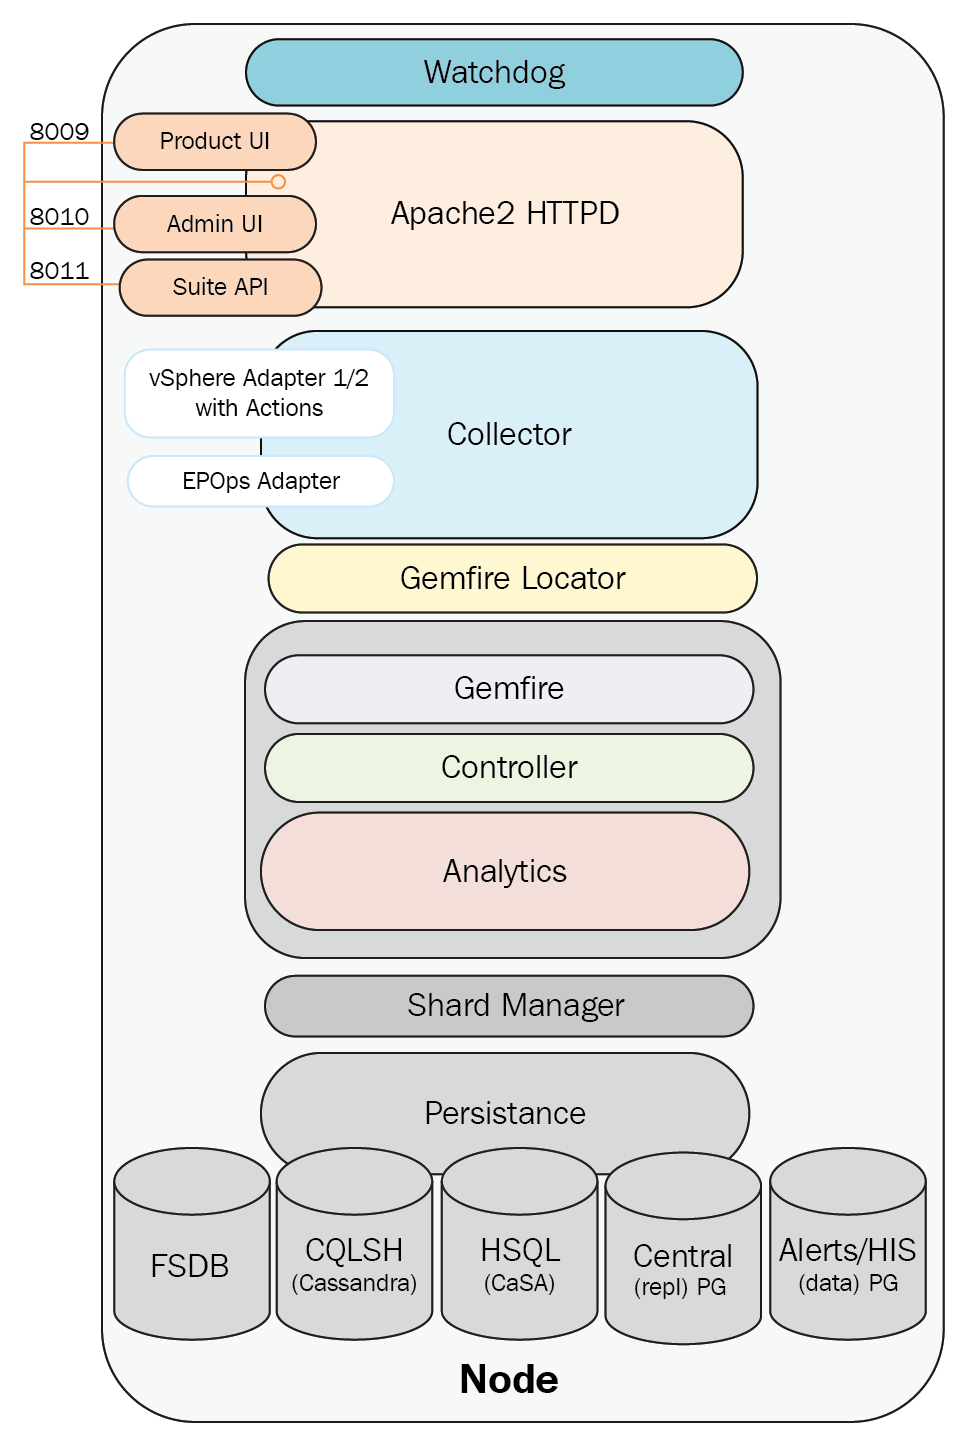
The components of the vRealize Operations 6.6 architecture are as follows:
- Watchdog
- The user interface
- Collector
- GemFire
- GemFire Locator
- Controller
- Analytics
- Persistence
The Watchdog service
Watchdog is a vRealize Operations service that maintains the necessary daemons/services and attempts to restart them as necessary should there be a failure. The vcops-watchdog is a Python script that runs every five minutes by means of the cops-watchdog-daemon with the purpose of monitoring the various vRealize Operations services, including the Cluster and Slice Administrator (CaSA).
The Watchdog service performs the following checks:
- PID file of the service
- Service status
The user interface
In vRealize Operations 6.6, the UI is broken into two components the Product UI, and the Admin UI. The Product UI is present on all nodes, with the exception of nodes that are deployed as remote collectors.
The Admin UI is a web application hosted by Pivotal tc Server (Java application Apache web server), and is responsible for making HTTP REST calls to the admin API for node administration tasks. The CaSA is responsible for cluster administrative actions, such as the following:
- Enabling/disabling the vRealize Operations cluster
- Enabling/disabling cluster nodes
- Performing software updates
- Browsing log files
The Admin UI is purposely designed to be separate from the Product UI and to always be available for administration and troubleshooting-type tasks. A small database caches data from the Product UI that provides the last known state information to the Admin UI in the event that the Product UI and analytics are unavailable.
The Product UI is the main vRealize Operations graphical user interface. Like the Admin UI, the Product UI is based on Pivotal tc Server, and can make HTTP REST calls to the CaSA for administrative tasks; however, the primary purpose of the Product UI is to make GemFire calls to the Controller API to access data and create views, such as dashboards and reports.
The Apache2 HTTPD also provides the backend platform for another Tomcat instances. The Suite API is a public-facing API that can be used for automating/scripting common tasks. It is also used internally by vRealize Operations for carrying out numerous administrative tasks. The End Point Operations Management Adapter, HTTP Post Adapter, and Telemetry are also run by this Tomcat instance.
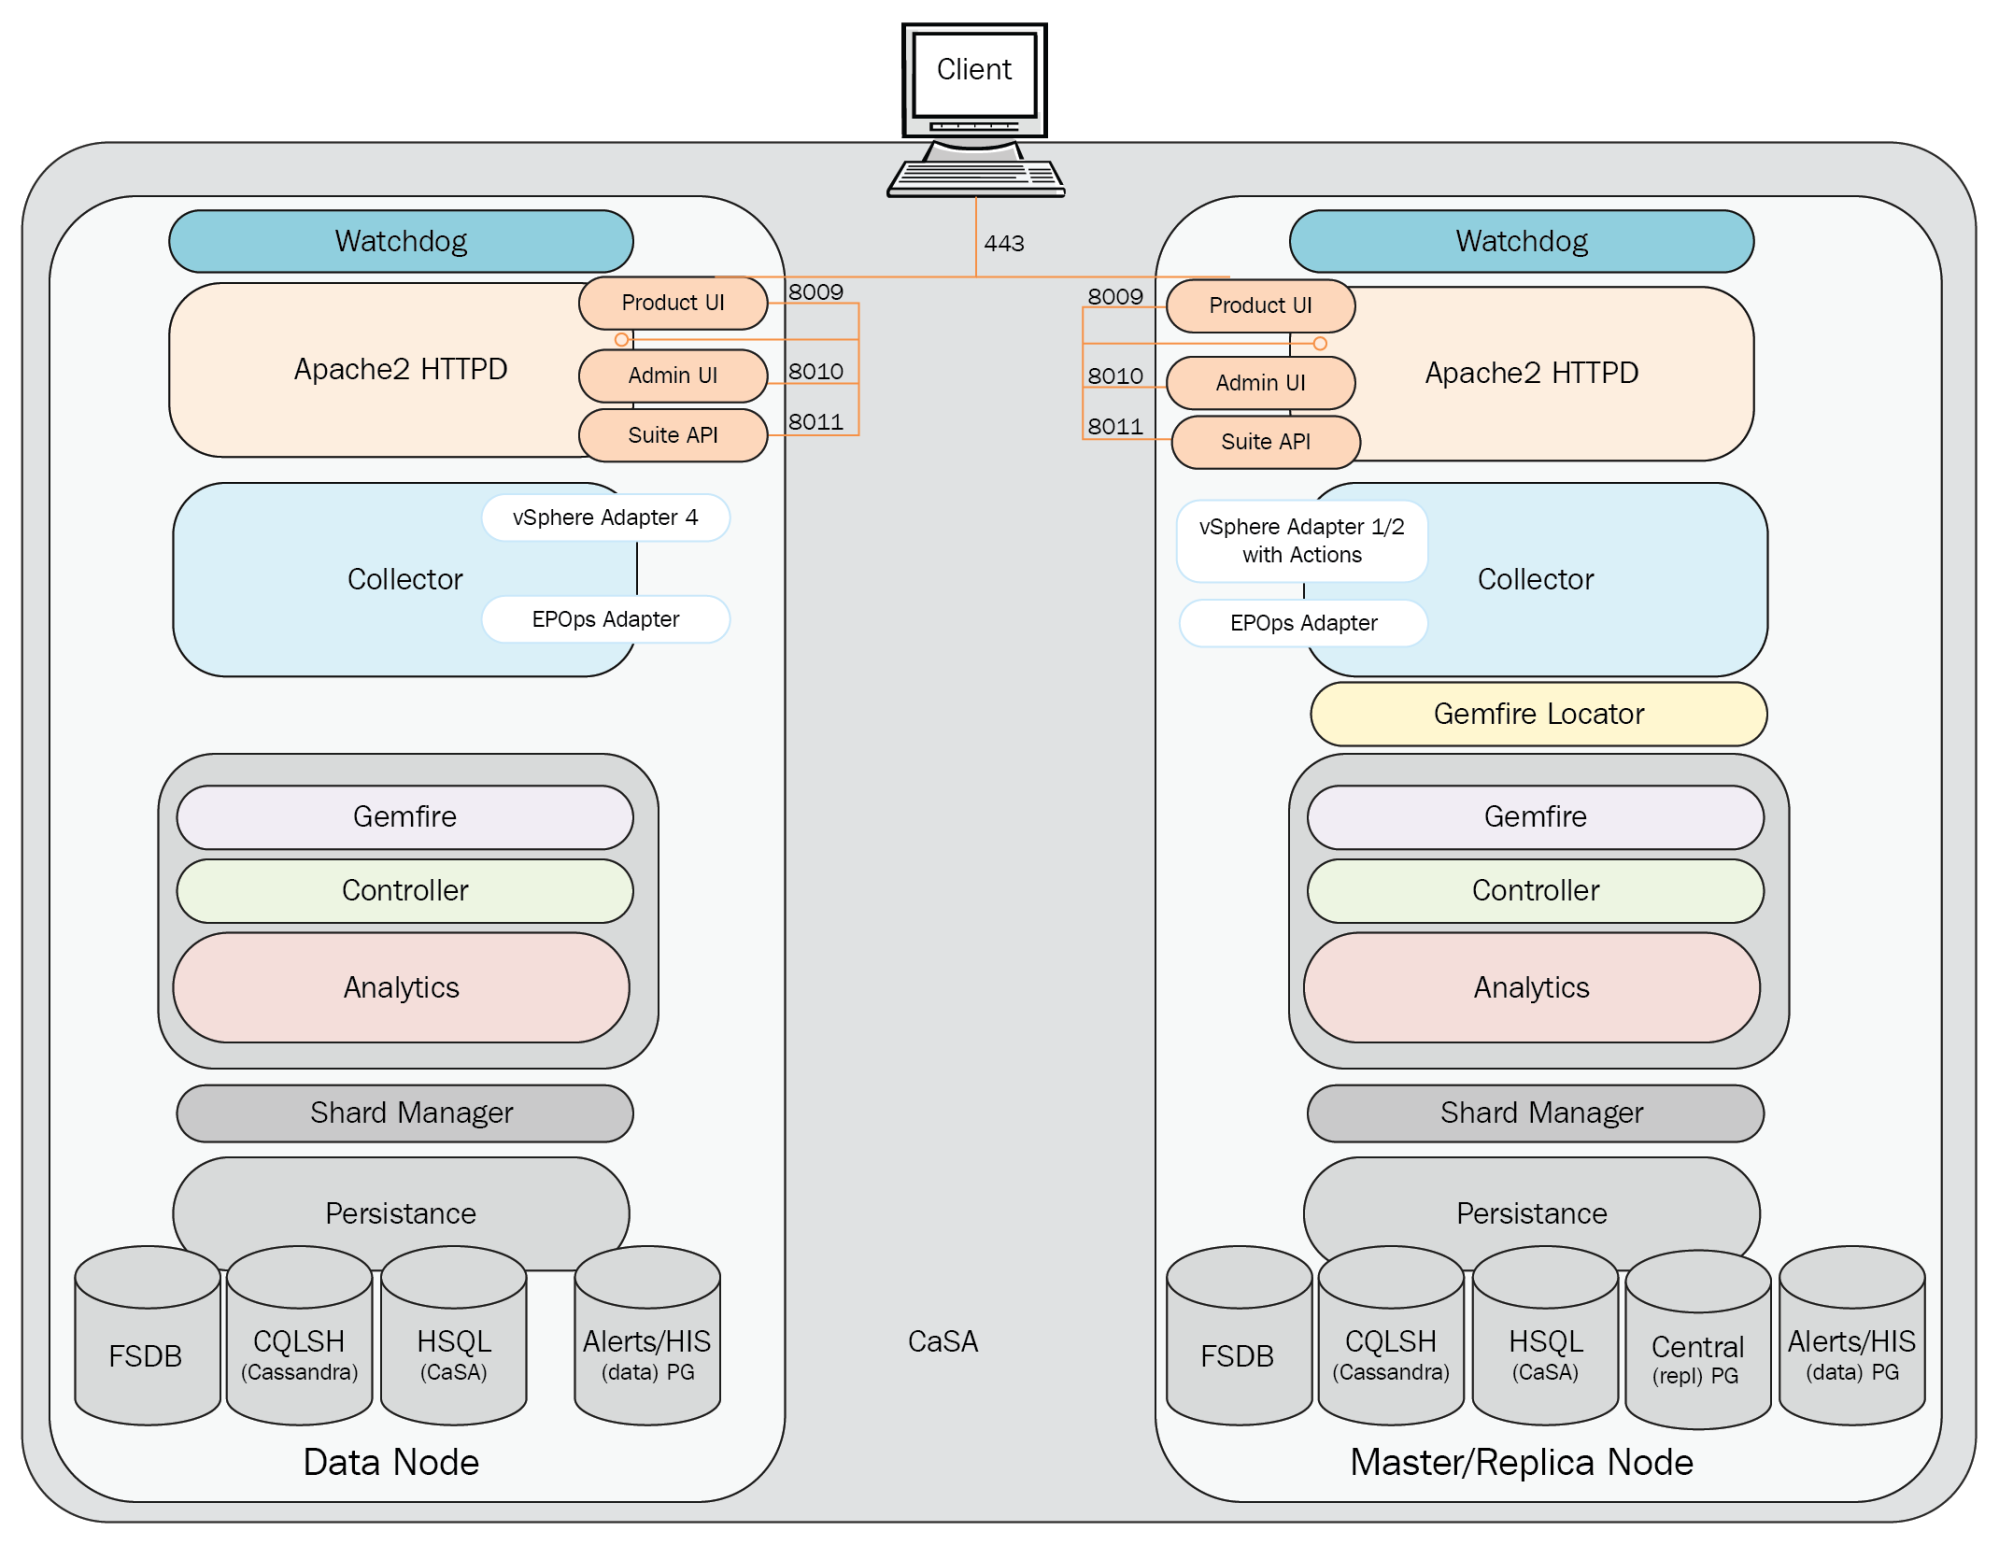
As shown in the following diagram, the Product UI is simply accessed via HTTPS on TCP 443. Apache then provides a reverse proxy back to the Product UI running in tc Server using the Apache APJ protocol:
The Collector
The Collector process is responsible for pulling in inventory and metric data from the configured sources. As shown in the following diagram, the Collector uses adapters to collect data from various sources, and then contacts the GemFire locator for connection information to one or more Controller cache servers. The Collector service then connects to one or more Controller API GemFire cache servers, and sends the collected data.
It is important to note that although an instance of an adapter can only be running on one node at a time, it does not imply that the collected data is being sent to the Controller on that node.
The Collector will send a heartbeat to the Controller every 30 seconds. This is sent via the HeartbeatThread thread process running on the Collector. It has a maximum of 25 data collection threads. Vice versa, the Controller node, vice versa, runs a HeartbeatServer thread process which processes heartbeats from Collectors. The CollectorStatusChecker thread process is a DistributedTask which uses data from HeartbeatServers to decides whether the Collector is up or down.
By default, the Collector will wait for 30 minutes for adapters to synchronize.
The vSphere adapter provides the Collector process with the configuration information needed to pull in vCenter inventory and metric data. It consists of configuration files and a JAR file. A separate adapter instance is configured for each vCenter Server.
The Python adapter provides the Collector process with the configuration information needed to send remediation commands back to a vCenter Server (power on/off VM, vMotion VM, reconfigure VM, and so on).
The End Point Operations Management adapter is installed and listening by default on each vRealize Operations node. To receive data from operating systems, the agent must be installed and configured on each guest OS to be monitored.
The Horizon adapter provides the Collector process with the configuration information needed to pull in the Horizon View inventory and metric data. A separate adapter instance is configured for each Horizon View pod, and only one adapter instance is supported per vRealize Operations node with a limit of 10,000 Horizon objects:

The GemFire
VMware vFabric® GemFire® is an in-memory, low-latency data grid, running in the same JVM as the Controller and Analytics, that scales as needed when nodes are added to the cluster. It allows the caching, processing, and retrieval of metrics, and is functionally dependent on the GemFire Locator.
The GemFire locator
The vFabric GemFire locator runs on the master and master replica nodes. The data nodes and remote Collectors run GemFire as a client process.
The Controller
The Controller is a sub-process of the Analytics process, and is responsible for coordinating activity between the cluster members. It manages the storage and retrieval of the inventory of objects within the system. The queries are performed leveraging the GemFire MapReduce function that allows for selective querying. This allows for efficient data querying, as data queries are only performed on select nodes rather than all nodes.
The Controller will monitor the Collector status every minute. It also monitors how long a deleted resource is available in the inventory, and how long a non-existing resource is stored in the database.
Analytics
Analytics is the heart of vRealize Operations, as it is essentially the runtime layer for data analysis. The role of the Analytics process is to track the individual states of every metric, and then use various forms of correlation to determine if there are problems.
At a high level, the Analytics layer is responsible for the following tasks:
- Metric calculations
- Dynamic thresholds
- Alerts and alarms
- Metric storage and retrieval from the Persistence layer
- Root cause analysis
- Historic Inventory Server (HIS) version metadata calculations and relationship data
Analytics components work with the new GemFire-based cache, Controller, and Persistence layers. The Analytics process is also responsible for generating SMTP and SNMP alerts on the master and master-replica nodes.
Persistence
The Persistence (the database) layer, as its name implies, is the layer where the data is persisted to disk. The layer primarily consists of a series of databases performing different functions, and having different roles.
vRealize Operations uses two data storage solutions:
- Postgres: This is a relational database that stores the configuration and state of the data
- FSDB: This is a proprietary high-performance filesystem-based repository that stores all the time series data
Understanding the Persistence layer is an important aspect of vRealize Operations, as this layer has a strong relationship with the data and service availability of the solution.
vRealize Operations has five primary database services, as follows:
|
Common name |
Role |
DB type |
Sharded |
Location |
|
Cassandra DB |
User preferences and configuration, alerts definition, customizations, dashboards, policies, view, reports, licensing, shard maps, activities |
Apache Cassandra |
No |
/storage/db/vcops/cassandra |
|
Central ( Repl) DB |
Resource inventory |
PostgreSQL |
Yes |
/storage/db/vcops/vpostgres/data/ |
|
Alerts /HIS (Data) DB |
Alerts and alarm history, history of resource property data, history of resource relationship |
PostgreSQL |
Yes |
/storage/db/vcops/vpostgres/data/ |
|
FSDB |
Filesystem database containing the following: •RAW metrics •Super metrics data |
FSDB |
Yes |
/storage/db/vcops/data /storage/db/vcops/rollup |
|
CaSA DB |
Cluster and Slice Administrator data |
HSQL (Hyper SQL Database) |
No |
/storage/db/casa/webapp/ hsqlbd |
Sharding is the term that GemFire uses to describe the process of distributing data across multiple systems to ensure that compute, storage, and network load is evenly distributed across the cluster.
Cassandra DB
The Cassandra database was introduced in 6.1 to replace the Global xDB database. Apache Cassandra is a highly scalable, high-performance, distributed database. It is designed to handle large amounts of structured data across many nodes. It provides HA with no single point of failure. Cassandra is highly scalable, as it allows us to add more vRealize Operations nodes in the future to the existing cluster.
Currently, the database stores the following:
- User preferences and configuration
- Alerts definition
- Customizations
- Dashboards, policies, views
- Reports, licensing
- Shard maps
- Activities
Cassandra stores all the info that we see in the CONTENT folder; basically any settings that are applied globally.
Central (repl) DB
The Postgres database was introduced in 6.1. It has two instances in version 6.6. The Central Postgres DB, also called repl and the Alerts/HIS Postgres DB, also called data, are two separate database instances under the database called vcopsdb.
The Central DB exists only on the master and the master-replica node when HA is enabled. It is accessible via port 5433 and it is located in /storage/db/vcops/vpostgres/repl.
Currently, the database stores only resource inventory information.
Alerts /HIS (Data) DB
The Alerts DB is called data on all the data nodes including Master and Master-replica node. It was again introduced in 6.1. Starting from 6.2, the Historical Inventory Service xDB was merged with the Alerts DB. It is accessible via port 5432, and it is located in /storage/db/vcops/vpostgres/data.
Currently, the database stores the following:
- Alerts and alarm history
- History of resource property data
- History of resource relationship
HSQL DB
The HSQL (or CaSA) database is a small, flat, JSON-based, in-memory DB that is used by CaSA for cluster administration.
FSDB
The FSDB contains all raw time series metrics and super metrics data for the discovered resources. It stores the data collected by adapters, and data that is calculated/generated (such as a system, badge, and metrics) based on the analysis of that data.
FSDB is a GemFire server, and runs inside the analytics JVM. It uses Sharding Manager to distribute data between nodes (new objects). We will discuss what vRealize Operations cluster nodes are later in this chapter. The FSDB is available in all the nodes of a vRealize Operations cluster deployment.
vRealize Operations node types
vRealize Operations contains a common node architecture. Every vRealize Operations cluster consists of a master node, an optional replica node for HA, optional data nodes, and optional remote collector nodes.
When you install vRealize Operations , you use a vRealize Operations vApp deployment to create roleless nodes. After the nodes are created, you can configure them according to their role. You can create roleless nodes all at once or as needed. A common as-needed practice might be to add nodes to scale out vRealize Operations to monitor an environment as the environment grows larger.
Here is a low-level overview of the different node types, the component roles they can have, and the communication ports they use:

Although deployment will be discussed in detail in later chapters, from a design perspective it is important to understand the different roles, and what deployment model best fits your own environment.
The master and master replica nodes
The master or master replica node is critical to the availability of the vRealize Operations cluster. It contains all vRealize Operations services, including UI, Controller, Analytics, Collector, and Persistence, as well as critical services that cannot be replicated across all cluster nodes. These include the following:
- NTP server
- GemFire locator
During a failure event of the master node, the master replica DB is promoted to a full read/write master. Although the process of replica DB promotion can be done online, the migration of the master role during a failover does require an automated restart of the cluster. As a result, even though it is an automated process, the failure of the master node will result in a temporary outage of the vRealize Operations cluster until all nodes have been restarted against the new master.
The master also has the responsibility for running both an NTP server and client. On initial configuration of the first vRealize Operations node, you are prompted to add an external NTP source for time synchronization. The master node then keeps time with this source, and runs its own NTP server for all data and collector nodes to sync from. This ensures all nodes have the correct time, and only the master/master replica requires access to an external time source.
The final component that is unique to the master role is the GemFire locator. The GemFire locator is a process that tells starting or connecting data nodes where running cluster members are located; this process also provides load balancing of queries that are passed to data nodes that then become data coordinators for that particular query:

The data node
The data node is the standard vRealize Operations role, and is the default when adding a new node into an existing cluster. It provides the core functionality of collecting and processing data and data queries, as well as extending the vRealize Operations cluster by being a member of the GemFire Federation that, in turn, provides the horizontal scaling of the platform.
As shown in the following diagram, a data node is almost identical to a master/master replica node, with the exception of the Central vPostgres database, NTP server, and GemFire locator:

The remote collector node
The remote collector node is a continuation of the vCenter Operations Manager 5.x installable concept around having a standalone collector for remote sites or secure enclaves. Remote collectors do not process data themselves; instead, they simply forward on metric data to data nodes for analytics processing.
Remote collector nodes do not run several of the core vRealize Operations components, including the following:
- Product UI
- Controller
- GemFire locator
- Analytics
- Persistence
As a result of not running these components, remote collectors are not members of the GemFire federation, and although they do not add resources to the cluster, they themselves require far fewer resources to run, which is ideal in smaller remote office locations:

Multi-node deployment, HA, and scalability
So far, we have focused on the new architecture and components of vRealize Operations 6.6, as well as starting to mention the major architectural changes that the GemFire-based Controller, Analytics, and Persistence layers have introduced. Now, before we close this chapter, we will dive down a little deeper into how data is handled in multi-node deployment, and, finally, how HA works in vRealize Operations 6.6, and what design decisions revolve around a successful deployment.
We are also going to mention what scalability considerations you should make to configure your initial deployment of vRealize Operations based on anticipated usage.
GemFire clustering
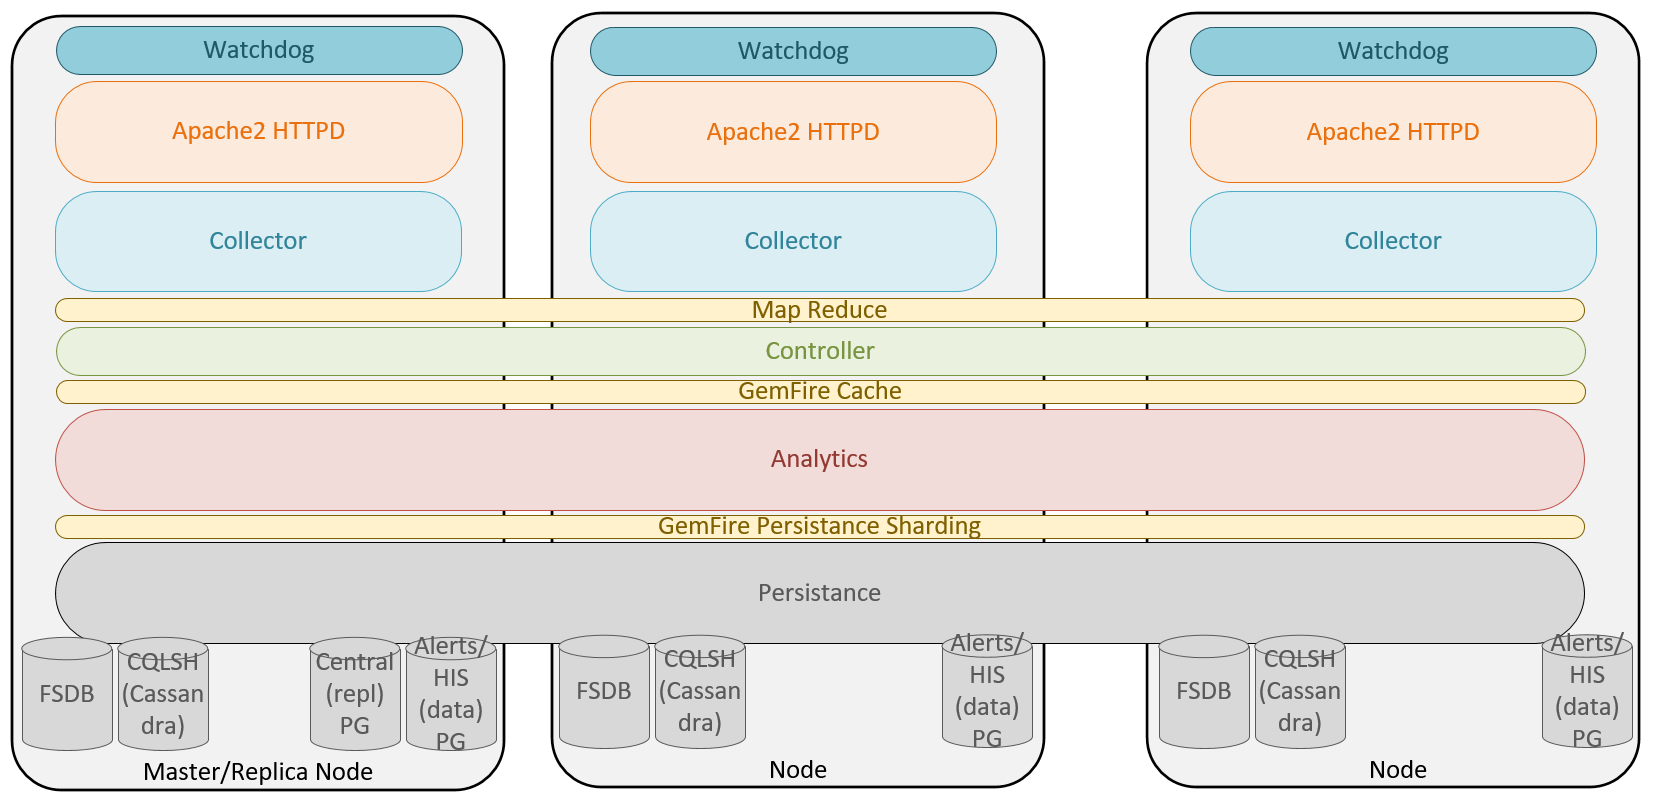
At the core of vRealize Operations, 6.6 architecture is the powerful GemFire in-memory clustering and distributed cache. GemFire provides the internal transport bus, as well as the ability to balance CPU and memory consumption across all nodes through compute pooling, memory sharing, and data partitioning. With this change, it is better to then think of the Controller, Analytics, and Persistence layers as components that span nodes, rather than individual components on individual nodes:
The migration to GemFire is probably the single largest underlying architectural change from vCenter Operations Manager 5.x, and the result of moving to a distributed in-memory database has made many of the new vRealize Operations 6.x features possible, including the following:
- Elasticity and scale: Nodes can be added on demand, allowing vRealize Operations to scale as required. This allows a single Operations Manager instance to scale to 6 extra large nodes in a cluster, which can support up to 180,000 objects and 45,000,000 metrics.
- Reliability: When GemFire HA is enabled, a backup copy of all data is stored in both the Analytics GemFire cache and the Persistence layer.
- Availability: Even with the GemFire HA mode disabled, in the event of a failure, other nodes take over the failed services and the load of the failed node (assuming the failure was not the master node).
- Data partitioning: vRealize Operations leverages GemFire data partitioning to distribute data across nodes in units called buckets. A partition region will contain multiple buckets that are configured during a startup, or migrated during a rebalance operation. Data partitioning allows the use of the GemFire MapReduce function. This function is a data-aware query, that supports parallel data querying on a subset of the nodes. The result of this is then returned to the coordinator node for final processing.
GemFire sharding
When describing the Persistence layer earlier, we listed the new components related to Persistence in vRealize Operations 6.6, Now it's time to discuss what sharding actually is.
GemFire sharding is the process of splitting data across multiple GemFire nodes for placement in various partitioned buckets. It is this concept in conjunction with the controller and locator services that balance the incoming resources and metrics across multiple nodes in the vRealize Operations Cluster. It is important to note that data is sharded per resource, and not per adapter instance. For example, this allows the load balancing of incoming and outgoing data, even if only one adapter instance is configured. From a design perspective, a single vRealize Operations cluster could then manage a maximum configuration vCenter by distributing the incoming metrics across multiple data nodes.
vRealize Operations data is sharded in both the Analytics and Persistence layers, which is referred to as GemFire cache sharding and GemFire Persistence sharding respectively.
Just because data is held in the GemFire cache on one node, this does not necessarily result in the data shard persisting on the same node. In fact, as both layers are balanced independently, the chance of both the cache shard and Persistence shard existing on the same node is 1/N, where N is the number of nodes.
Adding, removing, and balancing nodes
One of the biggest advantages of a GemFire-based cluster is the elasticity of adding nodes to the cluster as the number of resources and metrics grows in your environment. This allows administrators to add or remove nodes if the size of their environment changes unexpectedly; for example, a merger with another IT department, or catering for seasonal workloads that only exist for a small period of the year.
From a deployment perspective, we want to hide the complexities of scaling out from the user, so we deploy the whole stack at a time. When one instance/slice of the stack runs out of capacity (CPU/disk/memory), we can spin up another, and add more capacity. We can keep doing this as necessary to handle the scale.
Although adding nodes to an existing cluster is something that can be done at any time, there is a slight cost when doing so. As just mentioned, it is important when adding new nodes that they are sized the same as the existing cluster nodes; this will ensure during a rebalance operation that the load is distributed equally between the cluster nodes:
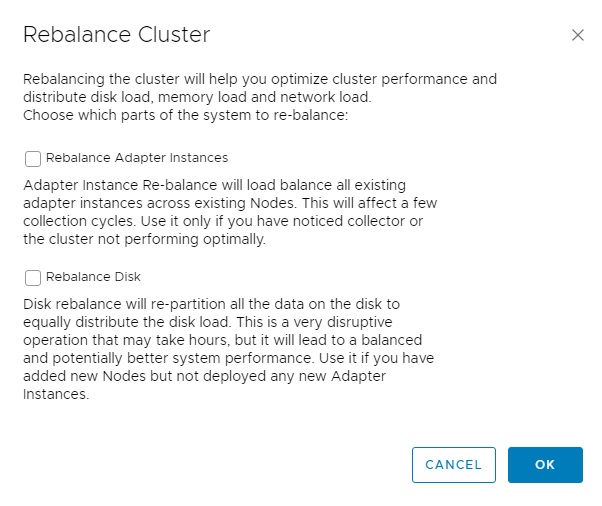
When adding new nodes to the cluster sometime after initial deployment, it is recommended that the Rebalance Disk option be selected under Cluster Management. As seen in the preceding figure, the warning advises that this is a very disruptive operation that may take hours and, as such, it is recommended that this be a planned maintenance activity. The amount of time this operation will take will vary depending on the size of the existing cluster and the amount of data in the FSDB. As you can probably imagine, if you are adding the eighth node to an existing seven-node cluster with tens of thousands of resources, there could potentially be several TBs of data that need to be re-sharded over the entire cluster. It is also strongly recommended that when adding new nodes the disk capacity and performance match that of existing nodes, as the Rebalance Disk operation assumes this is the case.
This activity is not required to start receiving the compute and network load balancing benefits of the new node. This can be achieved by selecting the Rebalance GemFire option, which is a far less disruptive process. As per the description, this process re-partitions the JVM buckets, balancing the memory across all active nodes in the GemFire federation. With the GemFire cache balanced across all nodes, the compute and network demand should be roughly equal across all the nodes in the cluster.
Although this allows early benefit from adding a new node into an existing cluster, unless a large number of new resources is discovered by the system shortly afterward, the majority of disk I/O for persisted, sharded data will occur on other nodes.
Apart from adding nodes, vRealize Operations also allows the removal of a node at any time, as long as it has been taken offline first. This can be valuable if a cluster was originally oversized for a requirement, and is considered a waste of physical compute resource; however, this task should not be taken lightly, as the removal of a data node without HA enabled will result in the loss of all metrics on that node. As such, it is recommended that removing nodes from the cluster is generally avoided.
High Availability in vRealize Operations 6.6
One of the features that came in vRealize Operations 6.0 was the ability to configure the cluster in an HA mode to prevent data loss. This still remains an impressive feature, used even today in vRealize Operations 6.6. Enabling HA makes two major changes to the Operations Manager cluster:
- The primary effect of HA is that all sharded data is duplicated by the Controller layer to a primary and backup copy in both the GemFire cache and GemFire Persistence layers.
- The secondary effect is that the master replica is created on a chosen data node for replication of the database. This node then takes over the role of the master node in the event that the original master fails.
How does HA and data duplication work?
As we just said, HA duplicates all incoming resource data so that two copies exist instead of one in both the GemFire cache and Persistence layers. This is done by creating a secondary copy of each piece of data that is used in queries, if the node hosting a primary copy is unavailable.
It is important to note that as HA is simply creating a secondary copy of each piece of data, as such only one node failure can be sustained at a time (N-1) without data loss, regardless of the cluster size. If a node is down, a new secondary shard of the data is not created unless the original node is removed from the cluster permanently.
When a failed node becomes available again, a node is placed into recovery mode. During this time, data is synchronized with the other cluster members and when the synchronization is complete, the node is returned to active status:
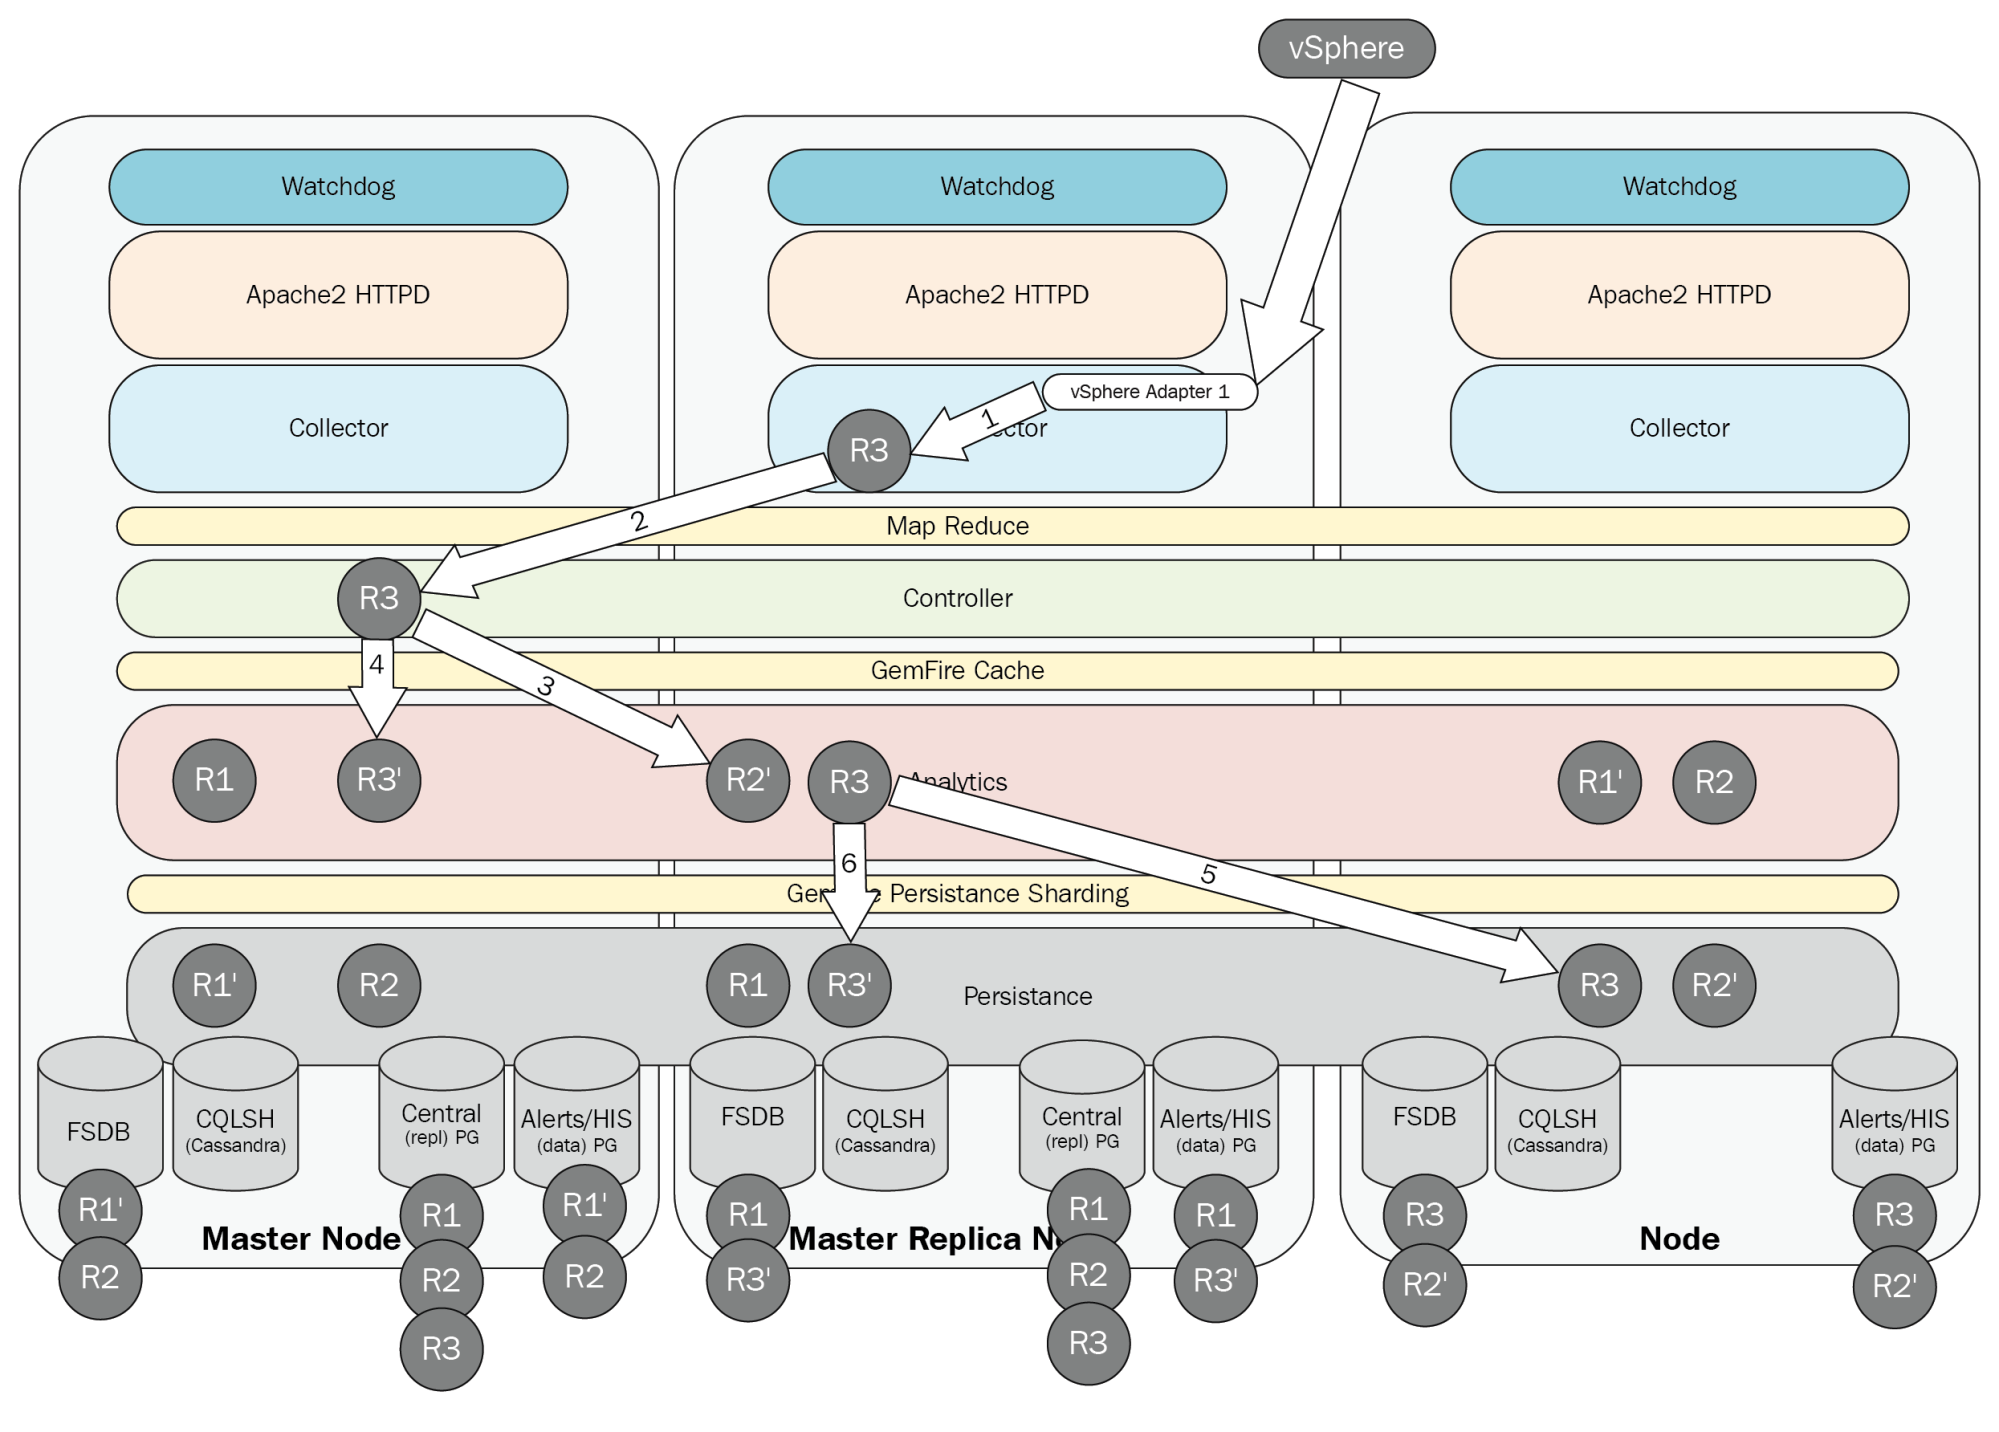
Let's run through this process using the diagram above for an example, about how incoming data or the creation of a new object is handled in an HA configuration. In the above diagram, R3 represents our new resource, and R3' represents the secondary copy:
- A running adapter instance receives data from vCenter, as it is required to create a new resource for the new object, and a discovery task is created.
- The discovery task is passed to the cluster. This task could be passed to any one node in the cluster, and once assigned, that node is responsible for completing the task.
- A new analytics item is created for the new object in the GemFire cache on any node in the cluster.
- A secondary copy of the data is created on a different node to protect against failure.
- The system then saves the data to the Persistence layer. The object is created in the inventory (HIS), and its statistics are stored in the FSDB.
- A secondary copy of the saved (GemFire Persistence sharding) HIS and FSDB data is stored on a different node to protect against data loss.
The following diagram shows the same duplication process, but this time for a non-HA setup:

In a non-HA scenario, the following happens when a new object is discovered:
- A new object is discovered by the adapter, which is located in the Collector.
- The Collector receives the object’s metric and property information from the adapter.
- The Collector sends the object information to the Controller.
- The global database is updated with the new object type information. The object is created in the central database.
- The object is also cached by the analytics component.
- The Alerts database is updated with object information.
Summary
In this chapter, we discussed the new common platform architecture design, and how vRealize Operations 6.6 differs from previous versions. We also covered the major components that make up the vRealize Operations 6.6 platform, and the functions that each of the component layers provides. This then moved into the various roles of each node type, and finally how multi-node, HA deployment functions.
In the next chapter, we will cover some design considerations and requirements around vRealize Operations 6.6.