


In more than 25 years of experience working in enterprise resource planning (ERP) consulting, every customer I've worked with put something of importance in Microsoft Excel. Why? The same reason you are reading this book. We all know how to use it, we like using it, and the people we share reports with know how to use it. However, we all want to know more about Excel, we all want to use it better, and (I cannot state this in big enough font) we want to impress someone with how great we are at using it. Yes, this means we want to share files and reports that make our colleagues and managers say, "Wow, how did you do this?," all while creating and managing these reports in less time.
Together, we will explore the power of Microsoft Excel 2016 and Microsoft Dynamics GP 2016 where we will build simple dashboards that looks anything but simple. Don't worry; we will not be doing any of the "developer-ish" stuff such as named ranges, macros, or VLOOKUPs. Microsoft has added so many amazing features to Excel that you can create amazing reports and dashboards all using native tools.
Before we can build a great Excel-based dashboard using the data in Dynamics GP 2016, we have to get the data out of GP and into Excel. This chapter covers eight major ways to get data from Dynamics GP into Excel, with a few extra options thrown in at the end.
By the end of this chapter, you should be able to get data into Excel using:
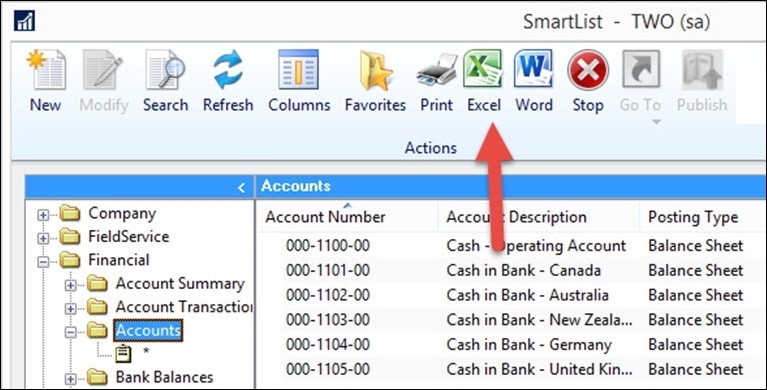
Exporting from a SmartList to Excel is the easiest and most commonly used method in Dynamics GP to get data to Microsoft Excel. We'll practice with an account summary SmartList.
To export from a SmartList to Excel for the Dynamics Rich Client, follow these steps:
In Dynamics GP 2016, go to Microsoft Dynamics GP | SmartList.
Click on the plus sign (+) next to
Financialand selectAccounts.Once the SmartList finishes loading, click on the large, green Excel button to export this SmartList to Excel:
To export from a SmartList to Excel for the Dynamics Web Client, follow these steps:
In Dynamics GP 2016, select Administration from the navigation panel on the left-hand side.
On the area page, go to Reports | SmartList.
Click on the plus sign (+) next to
Financialand selectAccounts.Once the SmartList finishes loading, click on the large green Excel button to export this SmartList to Excel.
Tip
In 2010, Microsoft revealed a previously unreleased Dex.ini switch that can dramatically improve the time it takes to export SmartLists to Microsoft Excel. The Dex.ini file is a launch file used to control system behavior, and this switch changes the behavior of an Excel export. Instead of sending data to Excel one line at a time, the switch tells Dynamics GP to bundle the SmartList lines together and send them to Excel as a group.
This switch is unsupported and can render the results differently than the default export process. Test this in your test system before using in production. The Dex.ini file is located in the Data folder of the Dynamics GP installation directory. To use this switch, add the following line to the Dex.ini file and restart Dynamics GP:
SmartlistEnhancedExcelExport=TRUE
While SmartList exports are great for sending Dynamics GP data to Excel for analysis, they aren't an ideal solution for a dashboard. SmartLists sends data to a new Excel file each time. It's a lot of work to export data and rebuild a dashboard every month. An improved option is to use a SmartList Export Solution.
SmartList Export Solutions let you export GP data to a saved Excel workbook. They also provide the option to run an Excel macro before and/or after the data populates in Excel. As an example, we will format the header automatically after exporting financial summary information.
We have a little setup work to do for this one first. Since these exports are typically repetitive, the setup is worth the effort. Here is how it's done:
Access SmartList in the same method used for SmartList exports (where you open SmartList depends on whether you are using the Rich Client or the Web Client of GP).
Go to
Financial|Account Summaryon the left-hand side to generate a SmartList.Click on the Excel button to send the SmartList to Excel.
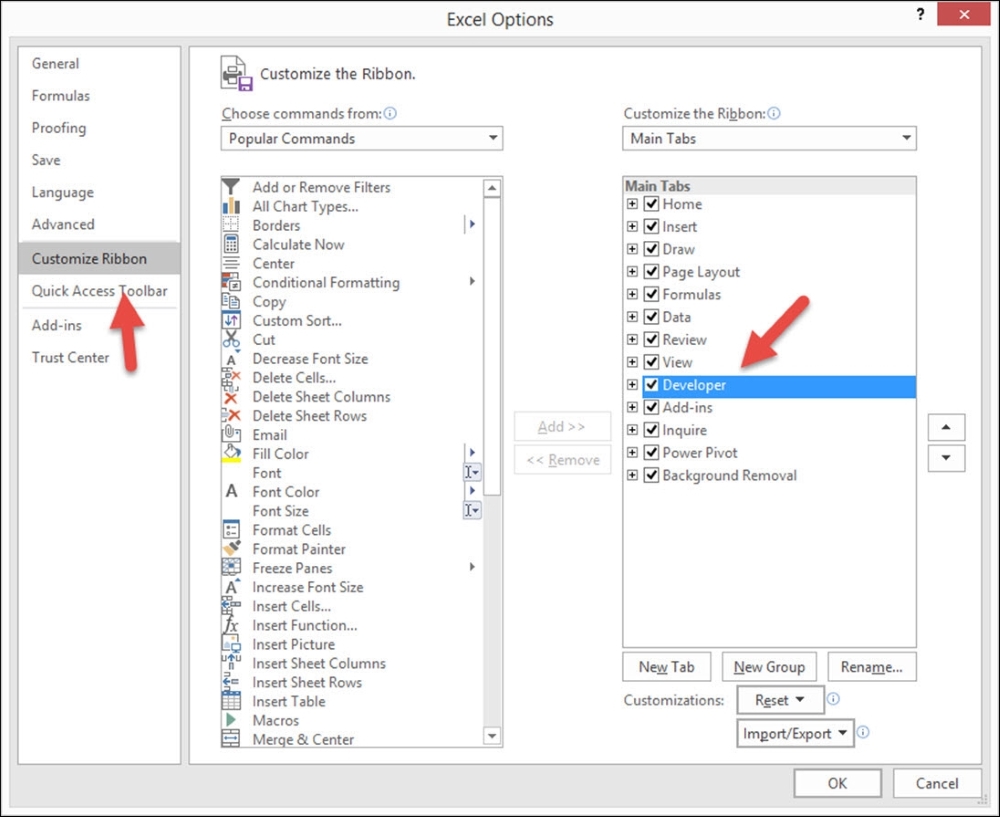
Next, we need to turn on Developer ribbon in Excel. In Excel 2016, go to File | Options | Customize Ribbon.
Select the box next to Developer on the right-hand side. Click on OK.
A SmartList Export Solution allows you to run an Excel macro before or after the data arrives to format or manipulate the information so that you only have to do it once. Let's record our Excel macro using these steps:
Click on the Developer tab and select Record Macro. Accept the default name of
Macro1and click on OK: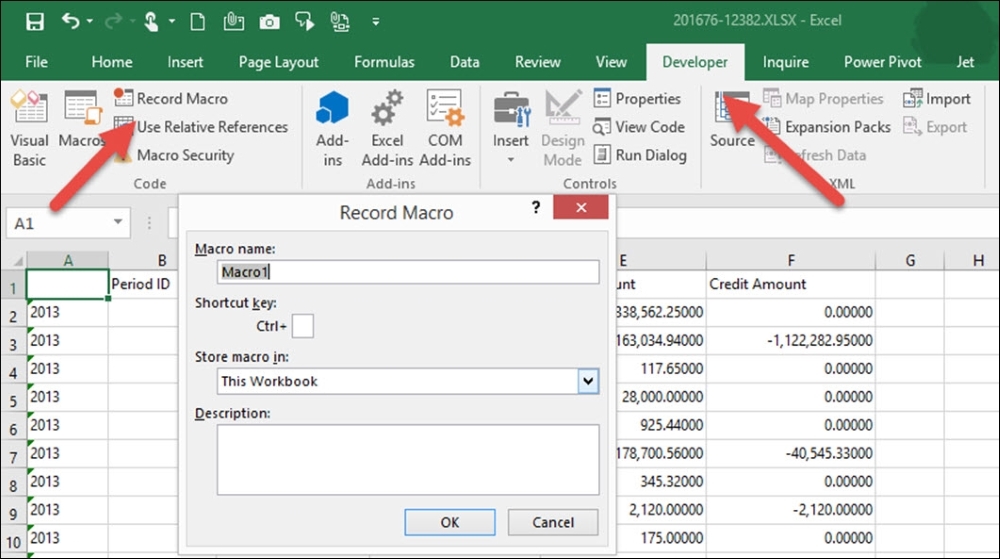
In Excel 2016, highlight rows 1-5, right-click, and select Insert.
Bold the titles in cells A6-F6 by highlighting them and clicking on the B icon on the Home ribbon.
In cell A1, enter
Sample Excel Solution.From the Developer tab, select Stop Recording.
Highlight and delete all the rows.
Save the blank file containing just the macro in
C:drive, with the name asAccountSummary.xlsm.
Now that we've prepared our Excel 2016 workbook to receive a SmartList, we need to set up and run the SmartList Export Solution using these steps:
Access SmartList in the same method used for SmartList exports (where you open SmartList depends on whether you are using the Rich Client or the Web Client of GP).
Go to
Financial|Account Summaryin the left pane to generate a SmartList.Click on Favorites. Go to Add | Add Favorite. The favorite can be named anything. I'm using
Export Solutionfor our example: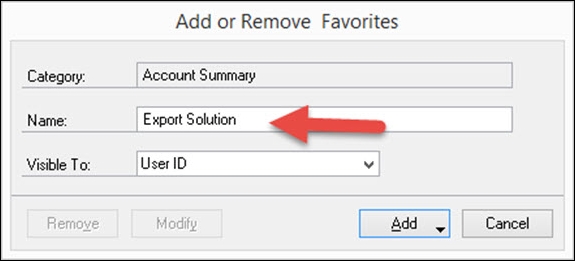
Back on the SmartList window, go to SmartList | Export Solutions. Name the solution
Export Solution. Set the path toC:\AccountSummary.xlsm(or where you saved your Excel file with the macro) and the completion macro toMacro1:
Select the box next to the SmartList favorite under
Account SummarynamedExport Solution:Make sure the Application is set to Excel. If not, change it:

Select Save and close the window.
Back in the SmartList window, select the
Export Solutionfavorite underAccount Summaryand click on the Excel button.Instead of immediately opening Excel, there are now two options. The Quick Export option performs a typical Excel export. We want the second option. Click on the Export Solution option. This will open the Excel file named
AccountSummary.xlsm, export the data, and run the macro namedMacro1, all with one click:
Click on the Export Solution option and watch the file open and the macro execute:

Without a doubt, this is a personal favorite method of getting GP data into Excel. "Why?" you ask. The reason is with Get and Transform you can:
Access your GP (SQL) data
Combine your GP data with non-GP data
Edit (or model) your GP data (by this, we mean you can combine fields, extract portions from fields, such as the year from a date, replace null values, and so on)
Merge or append tables together
And all of this can be done from within Excel without ever logging into a SQL tool such as the SQL Server Studio. You can have developer results while thinking like an Excel user and without being a developer.
Tip
There is a big advantage to learning this tool. It is the same tool that is used in Microsoft Power BI. So, learning this one tool in Excel gives you a huge advantage in Power BI.
In Excel 2013 and Excel 2010, this feature can be installed as an add-on called Power Query. Note that this feature only works on specific versions of Excel, so check the system requirements before downloading.
Tip
A table is a file that holds a set of records in the SQL Server. Imagine your chart of accounts being stored in an Excel spreadsheet, which could be a single table for some applications. However, many complex applications (such as Dynamics GP) often break up the information across several tables for efficiency. GP separates the chart of accounts into seven separate tables. Separating the data is good for the application, but confusing to non-developers or database administrators who just want a good Excel report.
To make it easier for users, often these virtual tables are created for the purpose of reporting to combine the data together and making the field names logical. A view is what a virtual table in the SQL Server is called. The chart of accounts information in GP, for example, can be found in an out-of-the-box view called Accounts.
Let's extract our list of General Ledger Accounts. Fortunately, Microsoft has already created this as a view in the SQL Database. This view has a lot of fields in it, but let's assume we want to make sure all of the accounts are set up with the correct type (Balance Sheet or Profit and Loss) so that when we close the year in the General Ledger, only the Balance Sheet accounts will roll forward into the new year. Follow these steps:
Open Microsoft Excel 2016.
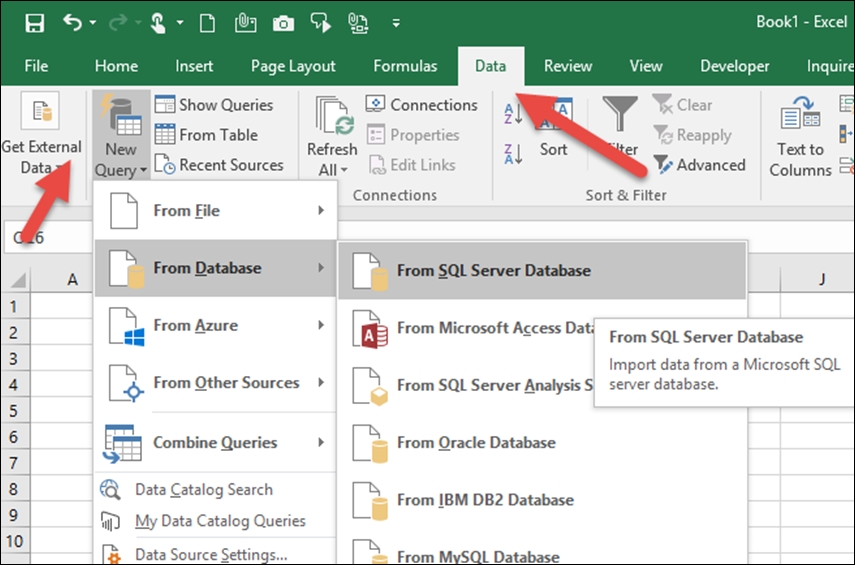
Go to Data | New Query | From Database | From SQL Server Database:
In the SQL Server Database window that appears, enter the name of your SQL Server instance in the Server and Database (optional) field. Our GP data is located on the server named
Cherryand the Database isTWO. Click on OK: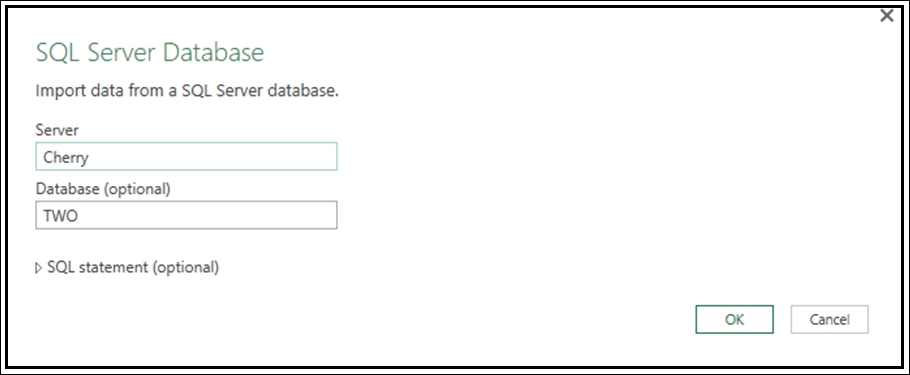
The Navigator window will open, displaying all the tables and views in the SQL Database you selected. Highlight the
Accountsview on the left-hand side. You will then get a preview of this view on the right-hand side. Click on Edit: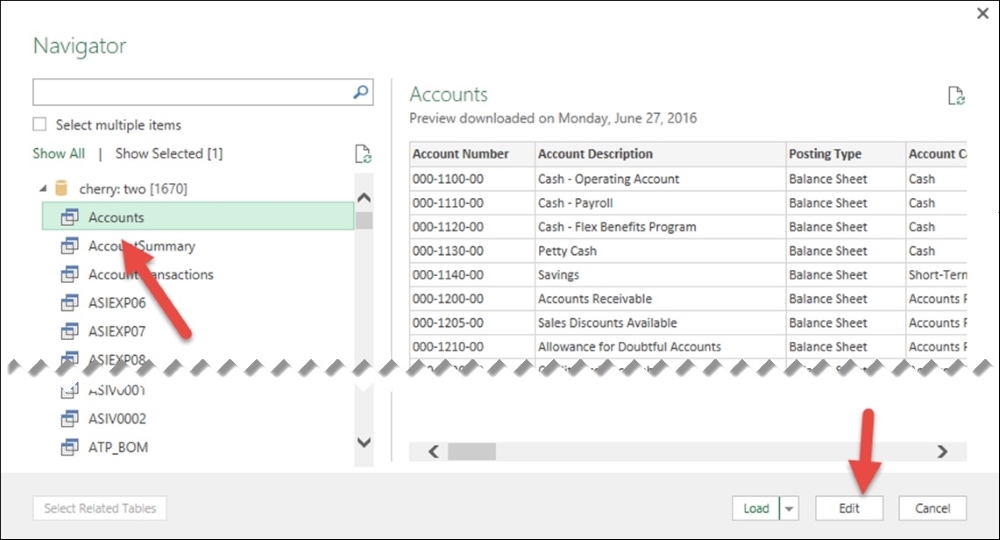
The Query Editor window will open with the
Accountsdata loaded. The first step should always be to rename this query to something that represents something that makes sense to the consumer of this report. We will rename ours toChart of Accounts: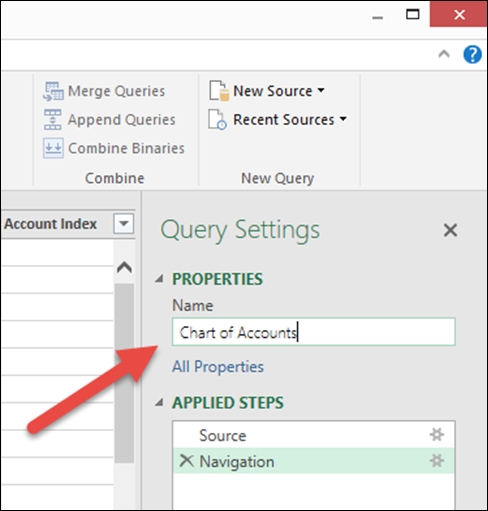
Click on the Table icon and select Choose Columns:
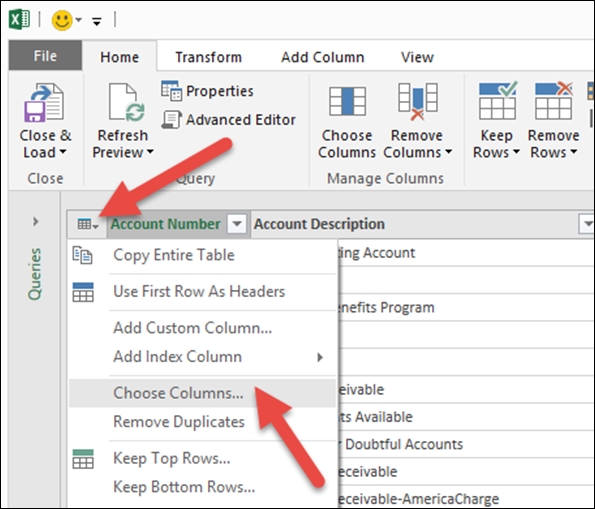
The Choose Columns window will open. Unmark the first item in the list titled (Select All Columns) so that we can manually select the ones we want to keep. Select Account Number, Account Description, Posting Type, Account Type, Active, and Created Date. Click on OK. Now, only the columns selected are displayed:

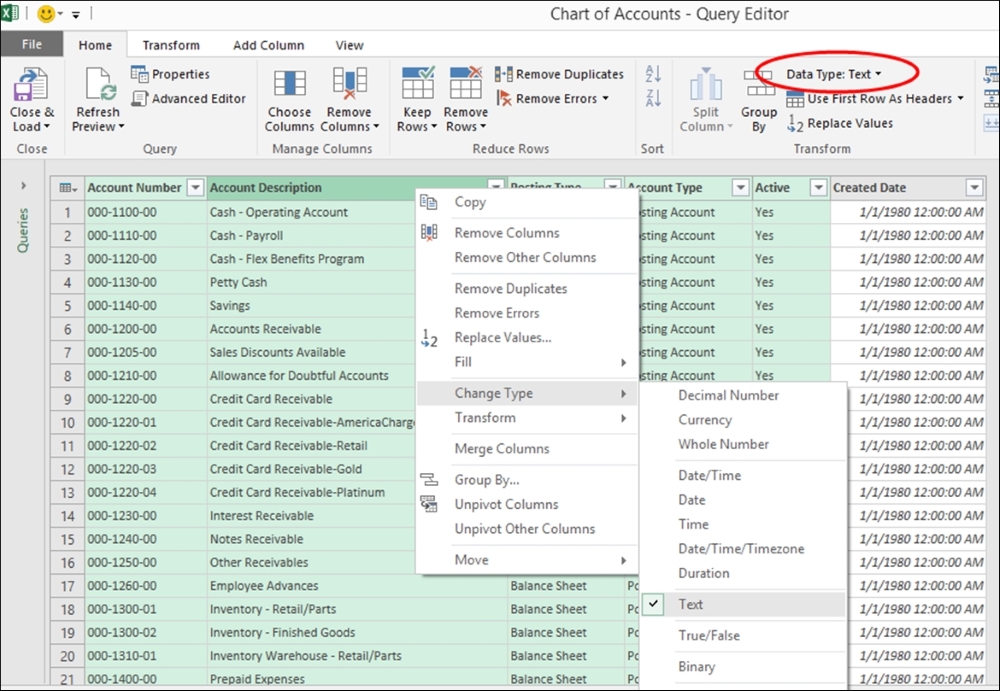
The second-most important step is verifying that the column data type is correct. Highlight the Account Number column, hold the Shift key down, and select the Active column so that all columns are highlighted. Right-click on the highlighted area and go to Change Type | Text. It might already be Text, but this just confirms. You can also highlight the columns one at a time and check the Data Type in the ribbon.
Highlight the last column, Created Date, right-click and go to Change Type | Date. This will change the date format from one that displays the time to one that displays only the date:
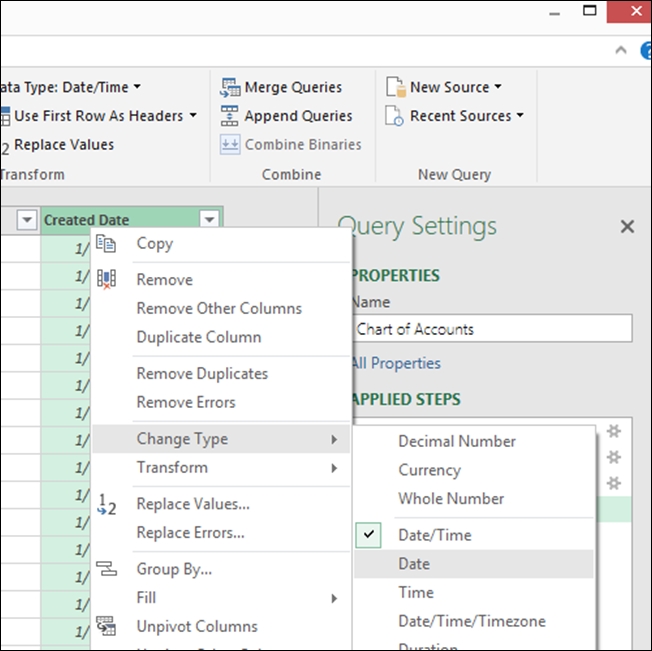
You'll notice that as we perform each step, our actions are recorded in the Applied Steps area. Get and Transform is actually recording everything we do, so when we use this query again, all of the steps will automatically be performed for us:

Each column has a filter, so you can choose to filter the data if you desire. Click on the words where the down arrow is located (not the icon) for Close & Load | Close & Load To… If we click on the icon, the data will flow into a table in Excel. Using the Close & Load To… feature, we can load the data into the Excel in-memory data model (Power Pivot):
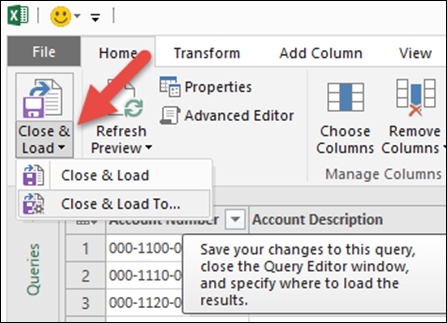
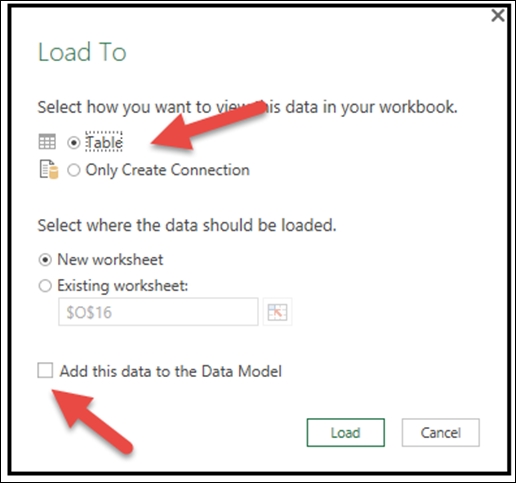
The Load To window opens. From here, you can either load the data to a table in the worksheet or create the connection only that would allow you to save the Excel file without the data. This allows you to refresh the data without saving a large file (but you must be connected to the SQL Server for this to refresh). You can also choose to add the data to the data model. The data is attached to the Excel file, but not visible to the spreadsheet. This is a great option if you only plan to create a PivotTable. Click on Load:
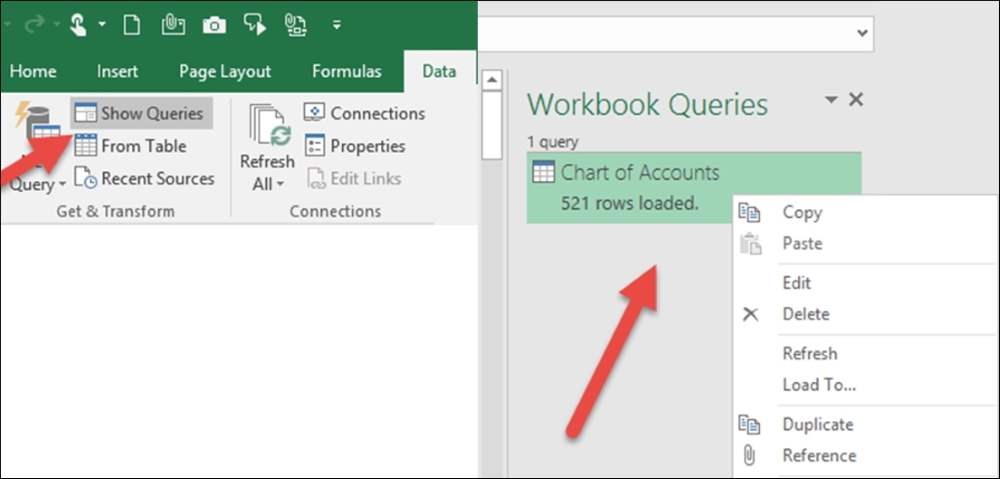
You'll notice there is a Workbook Queries pane whose display can be turned on or off using the Show Queries option on the Data ribbon. Right-clicking on the query provides you with many options, including the ability to Edit the query:
This is only a tiny fraction of what Get and Transform can do. You'll learn more about this great feature in Chapter 12, Sharing and Refreshing Data and Dashboards in Power BI.
Excel has its own method of importing external data from a variety of sources, including data in the SQL Server. This method can be embedded directly in the workbook or stored in a separate file, the Office Data Connection (ODC) file. When this .odc file is created, it can be reused over and over for a quick connection between your GP and Excel that is refreshable.
Let's create an .odc file to bring in our vendors using these steps:
In Excel 2016, go to Data | From Other Sources | From SQL Server:

The Data Connection window will open. Enter the name of your server and your GP log in credentials. Click on Next.

Select the database you want to report on and then select the view called
Vendors. Click on Finish:
The Import Data window will open, providing you with the option of either importing the data into an Excel Table, a PivotTable Report/PivotChart, or just creating the connection between SQL and Excel. Let's leave the option marked as Table and click on OK. The data will then import into the spreadsheet:

We'll find the location of the .odc file we created earlier, with the spreadsheet still open. Follow these steps:
Open the Connection Properties window by going to Data | Connections | Properties…
Click on the Definition tab, and the Connection File path will be displayed. For me, our file and path is
C:\Users\Belinda Allen\Documents\My Data Sources\cherry TWO Vendors.odc. As you can see, the actual.odcname is a combination of your server, your database, and the table/view you used for the connection:
One of the great features of using an .odc file is that once it is created, it can be used over and over again. Let's reuse the connection file we just created and follow these steps:
Open a blank Excel workbook. Go to Click Data | Existing Connections and scroll to find the connection you just created. For us, it is cherry TWO Vendors. Click on Open:

The Import Data window will open, asking how you want to view your data: Table, PivotTable Report/PivotChart, or if you just want to create a connection.
You'll then be prompted for your SQL login, which is the same as your GP login.
Microsoft provides prebuilt SSRS reports as part of Dynamics GP 2016. Deploying SSRS reports is included as an option during installation, but they can also be installed later. SSRS provides an easy path to send information to Microsoft Excel 2016.
To demonstrate this, start in Dynamics GP 2016 and follow these steps:
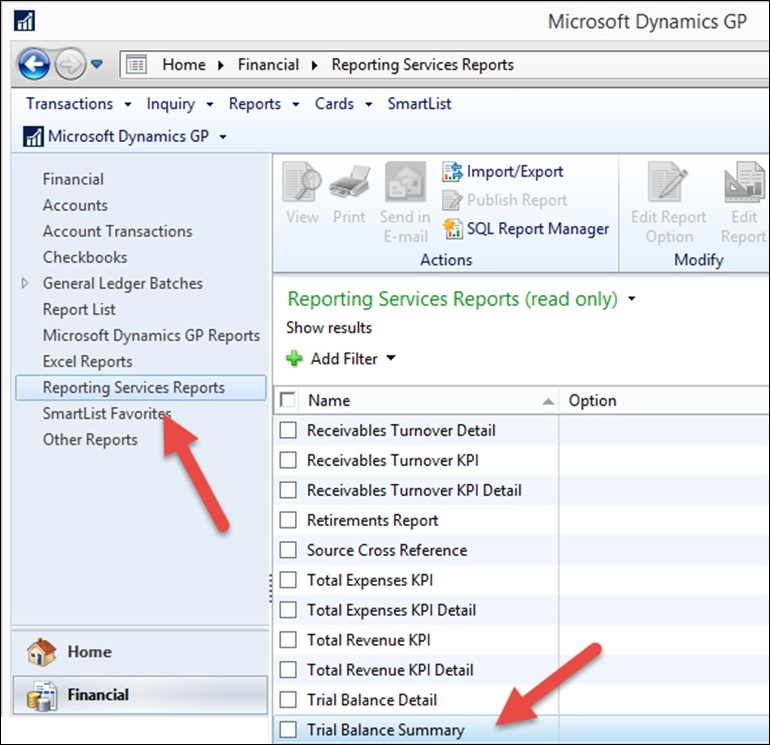
Select Financial from the navigation pane on the left-hand side.
In the list pane which is above the navigation pane, click on Reporting Services Reports.
In the center pane, scroll down and find Trial Balance Summary.
Double-click on Trial Balance Summary to open the report:
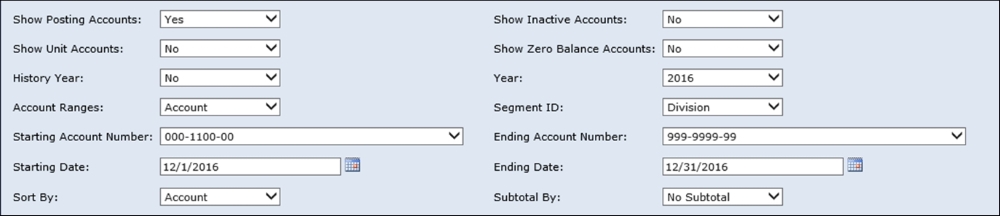
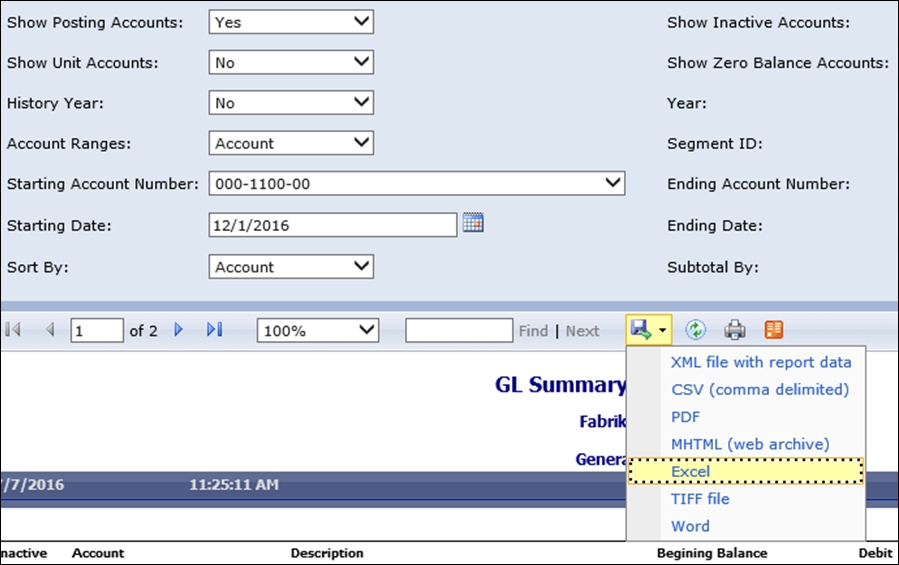
Once the report opens in a web browser, change the following criteria:
History Year: No
Year: 2016
Starting Account Number: 000-1100-00
Ending Account Number: 999-999-99
Starting Date: 12/01/2016
Ending Date: 12/31/2016
Sort By: Account
Click on View Report in the upper-right corner to run the Trial Balance Summary.
Select the disk icon and click on Excel:
If a security bar opens at the bottom asking Do you want to open or save..., select Open.
The Trial Balance Summary report now opens in Excel 2016.
Shortly after the release of Microsoft Dynamics GP 2016, Microsoft announced that the financial report writer, Management Reporter, was going into maintenance mode. This meant bug fixes would continue, but there would be no new features added. A large reason for this was Management Reporter's inability to go to the cloud. Entering this situation, Jet Reports to the rescue, offering a special release of the Express product to GP users free of charge.
What is Jet Reports? Jet Reports has an Excel add-on that enables Jet to work directly with your GP data in SQL. So, it's actually Excel that you are using to build reports. You may be wondering why wouldn't we build them in Excel directly. We asked that question. Once we used the product the first time, we had our answers:
The deliverable report shows no signs of how or where the connection occurred. In the past, we've written a lot of complex Excel reports for customers. More often than not, they have to keep referring to the original copy as they somehow blow away some of the settings. Jet allows the report recipient (viewer) to see only Excel formulas such as
SUM, not the connection information. This not only allows for tighter security; it makes the reports easier to consume.Changing from one company to the next is just three clicks.
These are just our personal reasons.
There are two elements of this free product: General Ledger (Basic) Financial Report writing and the Jet Table Builder. I'll cover these in more detail in Chapter 6, Introducing Jet Reports Express, and Chapter 7, Building Financial Reports in Jet Express for GP. Meanwhile, let's take a quick peek at how data flows into Excel from GP via Jet Express.
I also want to point out that Jet Reports will enable you to use your local version of Excel (installed on your computer) with your GP data. Jet Reports will work even if your GP data is in the cloud (hosted by a service data center or hosted in Azure.) The configuration to connect to your data is relatively simple, but outside the scope of this book.
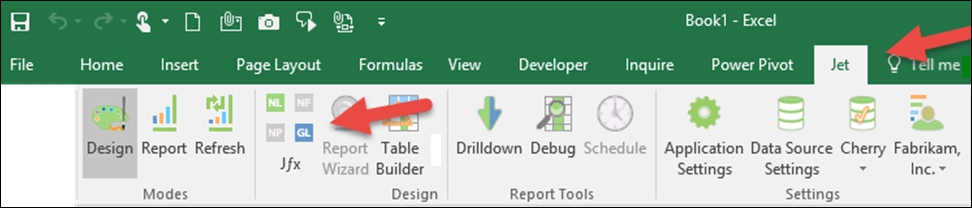
After Jet Reports is installed and configured, Jet will appear on the Menu bar in your Excel. Once Jet is clicked, the Jet ribbon will open. For financial statements, we only need the balance of accounts, so we would use the GL function to start building our statements:
Clicking on the GL function will open the Jet Function Wizard window. Using the wizard will allow you to simply "fill in the blanks." In the following screenshot, I've selected that we want to see a row for a range of accounts (000-1100-00 through 000-1140-00). There are also fields to add the criteria of a GL Account category(s), Budget, or to select a specific company (if we want to have a consolidated financial statement.) This will populate Excel with the account numbers:

To display the account name, we'll open the GL function window again and "fill in the blanks". We add a cell reference next to the number, select AccountName, and point to the Account Number cell:

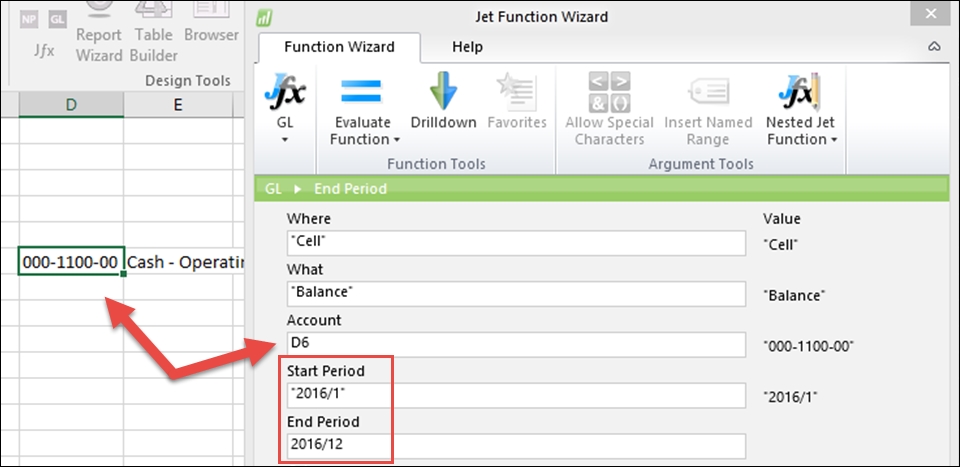
Finally, I'll use the GL function to add the account balance. We select cell, Balance, and reference the Account Number cell like we did earlier. I'll also select the period for which we want to report. I'll select the year 2016 for periods 1 through 12, allowing us to capture the entire year:
My Excel worksheet now looks like the following screenshot, as we are working (by default) in the Design mode. You'll notice that for each Excel cell that we entered data using the GL function wizard, a formula appears in the formula bar. Just as in native Excel, once you become familiar with the formula, you can skip the wizard window and enter the formula directly if you like. In cell A1, Jet entered some commands. This will automatically hide column A, so we can use it in formulas if we like:

Once we click on the Report mode, Jet retrieves all the data requested and displays the accounts, account names, and balances we requested:

Back in the
Design mode, I'll quickly perform some normal Excel formatting and add a Sum function:

By clicking on the Report mode again, our simple report of Cash looks ready for presentation:

As mentioned earlier, in Chapter 7, Building Financial Reports in Jet Express for GP, we'll walk together through building a financial statement.
The Table Builder in Jet Reports retrieves data from GP in a similar wizard-driven fashion, like the GL function earlier. It's easy to use, so I'll just reference you to Chapter 6, Introducing Jet Reports Express. We need to give you some reason to keep reading.
Microsoft Dynamics GP 2016 runs on SQL Server 2012, SQL Server 2014, and SQL Server 2016. Some companies, in particular those with advanced users, allow read-only access to Microsoft SQL Server to make it easy for users to get just the data they want. Often, this access is provided through the SQL Server Management Studio. Management Studio makes it easy to get data from GP 2016 to Microsoft Excel.
To see how easy this is, follow these steps:
Open the SQL Server Management Studio.
Connect to the SQL Server instance with Dynamics GP 2016 installed using either Windows Authentication or SQL Server Authentication with a user ID and password. If you have access to the SQL Server Management Studio, the login method and credentials will be provided by your database administrator. The user's GP login cannot be used.
Select New Query.
In the large, white box on the right-hand side, type
Use TWOand hit Enter to select the sampleTWOdatabase.Type
Select * from AccountSummaryand click on Execute to run the SQL query. The results will appear below the query: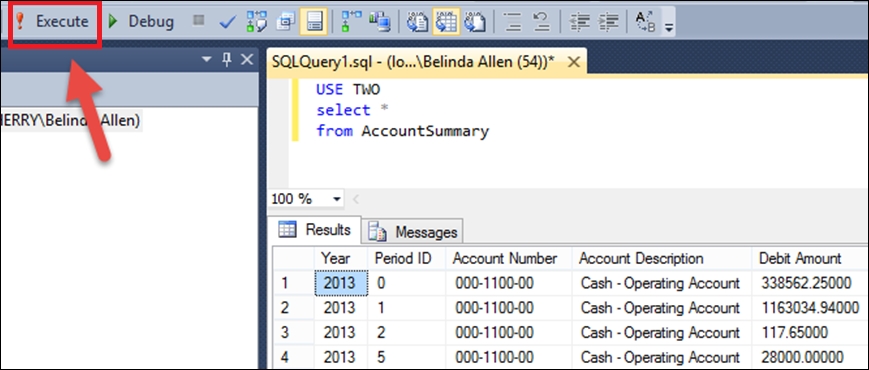
Go to Edit | Select All from the menu to highlight all of the results.
Go to Edit | Copy with Headers.
Open a blank Excel 2016 sheet. On the Home tab, click on the Paste icon in the upper-left corner to paste the data to Microsoft Excel.
Tip
There is a setting in the SQL Server that will export headers when copying, even if you forget to pick Copy with Headers. The setting can be found by going to Tools | Options | Query Results | SQL Server | Results To Grid. To activate it, select Include column headers when copying or saving the results.
Microsoft Dynamics GP Analysis Cubes for Excel (ACE) is an Online Analytical Processing (OLAP) tool from Microsoft, designed for Dynamics GP.
A full implementation of ACE is beyond the scope of this book, but Analysis Cubes are one of the best sources of data for Excel-based dashboards, so we need to spend a few minutes with them.
ACE takes data from Dynamics GP 2016 and places it in a SQL Server based data warehouse for use with the SQL Server Analysis Services. Usually, this is done once a day due to the volume of data that is being pushed through. At its simplest, a data warehouse is a separate place to store information to report off. Often, the data is optimized to improve the reporting process as it moves into the data warehouse. A multidimensional or OLAP cube not only optimizes the structure of the data to improve reporting, it can pre-calculate and aggregate information to make reporting even more powerful.
The term "data warehouse" can scare people. Some companies go through painfully long data warehouse implementations with careful definition of every element and arguments over how to normalize data for consistency. Forget all of that.
The beauty of a powerful ERP system, such as Microsoft Dynamics GP, is that the database design is known, documented, and doesn't change a lot from version to version. This means that a standard data warehouse can be built that works for companies using Dynamics GP, and it won't require months of work to set up.
The Dynamics GP Analysis Cubes product contains well-designed, aggregated tables for most Dynamics GP modules. For people using third-party add-ons, a customized cube with appropriate measures and dimensions would be required.
After you work through this book and build a few dashboards, you'll start to bump into some of the limitations of reporting directly off Dynamics GP data. These can include placing an undue load on the GP server, difficulty in finding and joining tables, and the struggle of calculating measures by hand. You'll also want to build more complex dashboards as you grow. Using Analysis Cubes for Excel is a great next logical step.
As ACE moves data into a data warehouse for reporting, data-heavy dashboards won't put a load on Dynamics GP. Also, because Analysis Cubes prepopulates and calculates information, complex calculations are available for reporting without having to create formulas in Excel. For example, in the next screenshot, you can see that Budget Variance, Current Ratio, Debit to Equity, and Gross Margin Percentage are all available in Analysis Cubes to simply drag into a pivot table for use in a dashboard. No calculation needed:

Additionally, users have the option of reporting against the data-warehouse relational database or reporting against the cubes.
From a practical standpoint, using Analysis Cubes is very similar to the process we will walk through in Chapter 2, The Ultimate GP to Excel Tool – Refreshable Excel Reports. The techniques used in this book to create a dashboard also work well when building an Analysis Cube based dashboard. Analysis Cubes for Dynamics GP is included in the starter pack in GP 2016, so customers upgrading from previous versions have an even stronger reason to implement it.
Note
For an in-depth look at some of these reporting solutions, including SSRS and Analysis Cubes, we recommend that you refer to Microsoft Dynamics GP 2010 Reporting by Chris Liley and David Duncan from Packt Publishing. Although this book references an older version of Dynamics GP, the content on Analysis Cubes will still be valid and work with the current version, Dynamics GP 2016.
All of the solutions we have discussed so far are either included with Microsoft Dynamics GP 2016 or are available as additional software from Microsoft. However, if you want to work with Microsoft Dynamics GP 2016 and Microsoft Excel, there are also a number of third-party solutions available. Selecting a third-party solution can be a challenging proposition.
It seems like every vendor remotely connected to reporting and Excel has put out what they term a Business Intelligence (BI) solution for Dynamics GP. Microsoft even referred to FRx, the financial reporting forerunner to Management Reporter, as a BI solution. This may be technically true, but when you say BI, the average user thinks of a dashboard, not a financial-reporting package.
The market has finally shaken out into a few categories with a lot of overlap. The options break down into reporting solutions that can produce dashboards. These are generally known as Corporate Performance Management (CPM) solutions and are more dashboard-focused solutions that can produce financial reports. For our purposes, I'm labeling these solutions as BI. It's really about where the vendor places the emphasis.
Additionally, the choices break down into those that report directly off data in Dynamics GP, those that use a just a data warehouse, and those that use OLAP cubes for their underlying data sources.
The continuum for costs and sophistication generally breaks down the same way. Solutions that report directly off GP data tend to be the least sophisticated and the cheapest. Solutions using a cube tend to be more expensive and more powerful.
We have an entire section of this book Section 3, Microsoft Power BI focusing on Microsoft's own Power BI. This is a simple and inexpensive dashboarding tool. It doesn't cover every company's needs, but it's certainly worth learning for your company's self-service business intelligence needs.
For the purposes of this book, we use the term data warehouse. Some vendors use the term data mart. Generally, a data mart is a specific subset of information in a data warehouse. For example, we might have a data warehouse of operational and financial information, but we segregate just the vendor and AP information into a data mart for use by the purchasing group. Vendors seem to use them interchangeably, with little regard for specific definitions, so for this book, we will use the term data warehouse for both.
The techniques shown in this book work pretty much the same whether you are reporting off a live connection to Dynamics GP, a data warehouse, or a multidimensional cube. Live reporting provides instant gratification. The use of a data warehouse improves the ability to scale reporting without increasing the load on the Dynamics GP server.
In this chapter we've looked at a number of ways to get data from Dynamics GP 2016 into Microsoft Excel 2016. Having a lot of options makes it possible to still build an effective dashboard in spite of those restrictions. How data gets extracted from GP totally depends on the rights and needs of the report creator and/or report consumer. We mention this so that you can experiment and find out which options work best for you and your company. Chances are that you'll use more than one option. If you end up needing all of them, let us know. Better yet, write a book for us to read! I've no doubt we'd learn a lot from you.
In the next chapter, we will look at one of the best and easiest options to access Microsoft Dynamics GP 2016 data—(the out of the box) refreshable Excel reports. In that chapter, we will start putting together the data that will eventually go into our dashboard.

