As soon as we start building a distributed system, traditional monitoring tools begin struggling with providing observability for the whole system, because they were designed to observe a single component, such as a program, a server, or a network switch. The story of a single component may no doubt be very interesting, but it tells us very little about the story of a request that touches many of those components. We need to know what happens to that request in all of them, end-to-end, if we want to understand why a system is behaving pathologically. In other words, we first want a macro view.
At the same time, once we get that macro view and zoom in to a particular component that seems to be at fault for the failure or performance problems with our request, we want a micro view of what exactly happened to that request in that component. Most other tools cannot tell that to us either because they only observe what "generally" happens in the component as a whole, for example, how many requests per second it handles (metrics), what events occurred on a given thread (logs), or which threads are on and off CPU at a given point in time (profilers). They don't have the granularity or context to observe a specific request.
Distributed tracing takes a request-centric view. It captures the detailed execution of causally-related activities performed by the components of a distributed system as it processes a given request. In Chapter 3, Distributed Tracing Fundamentals, I will go into more detail on how exactly it works, but in a nutshell:
Tracing infrastructure attaches contextual metadata to each request and ensures that metadata is passed around during the request execution, even when one component communicates with another over a network.
At various trace points in the code, the instrumentation records events annotated with relevant information, such as the URL of an HTTP request or an SQL statement of a database query.
Recorded events are tagged with the contextual metadata and explicit causality references to prior events.
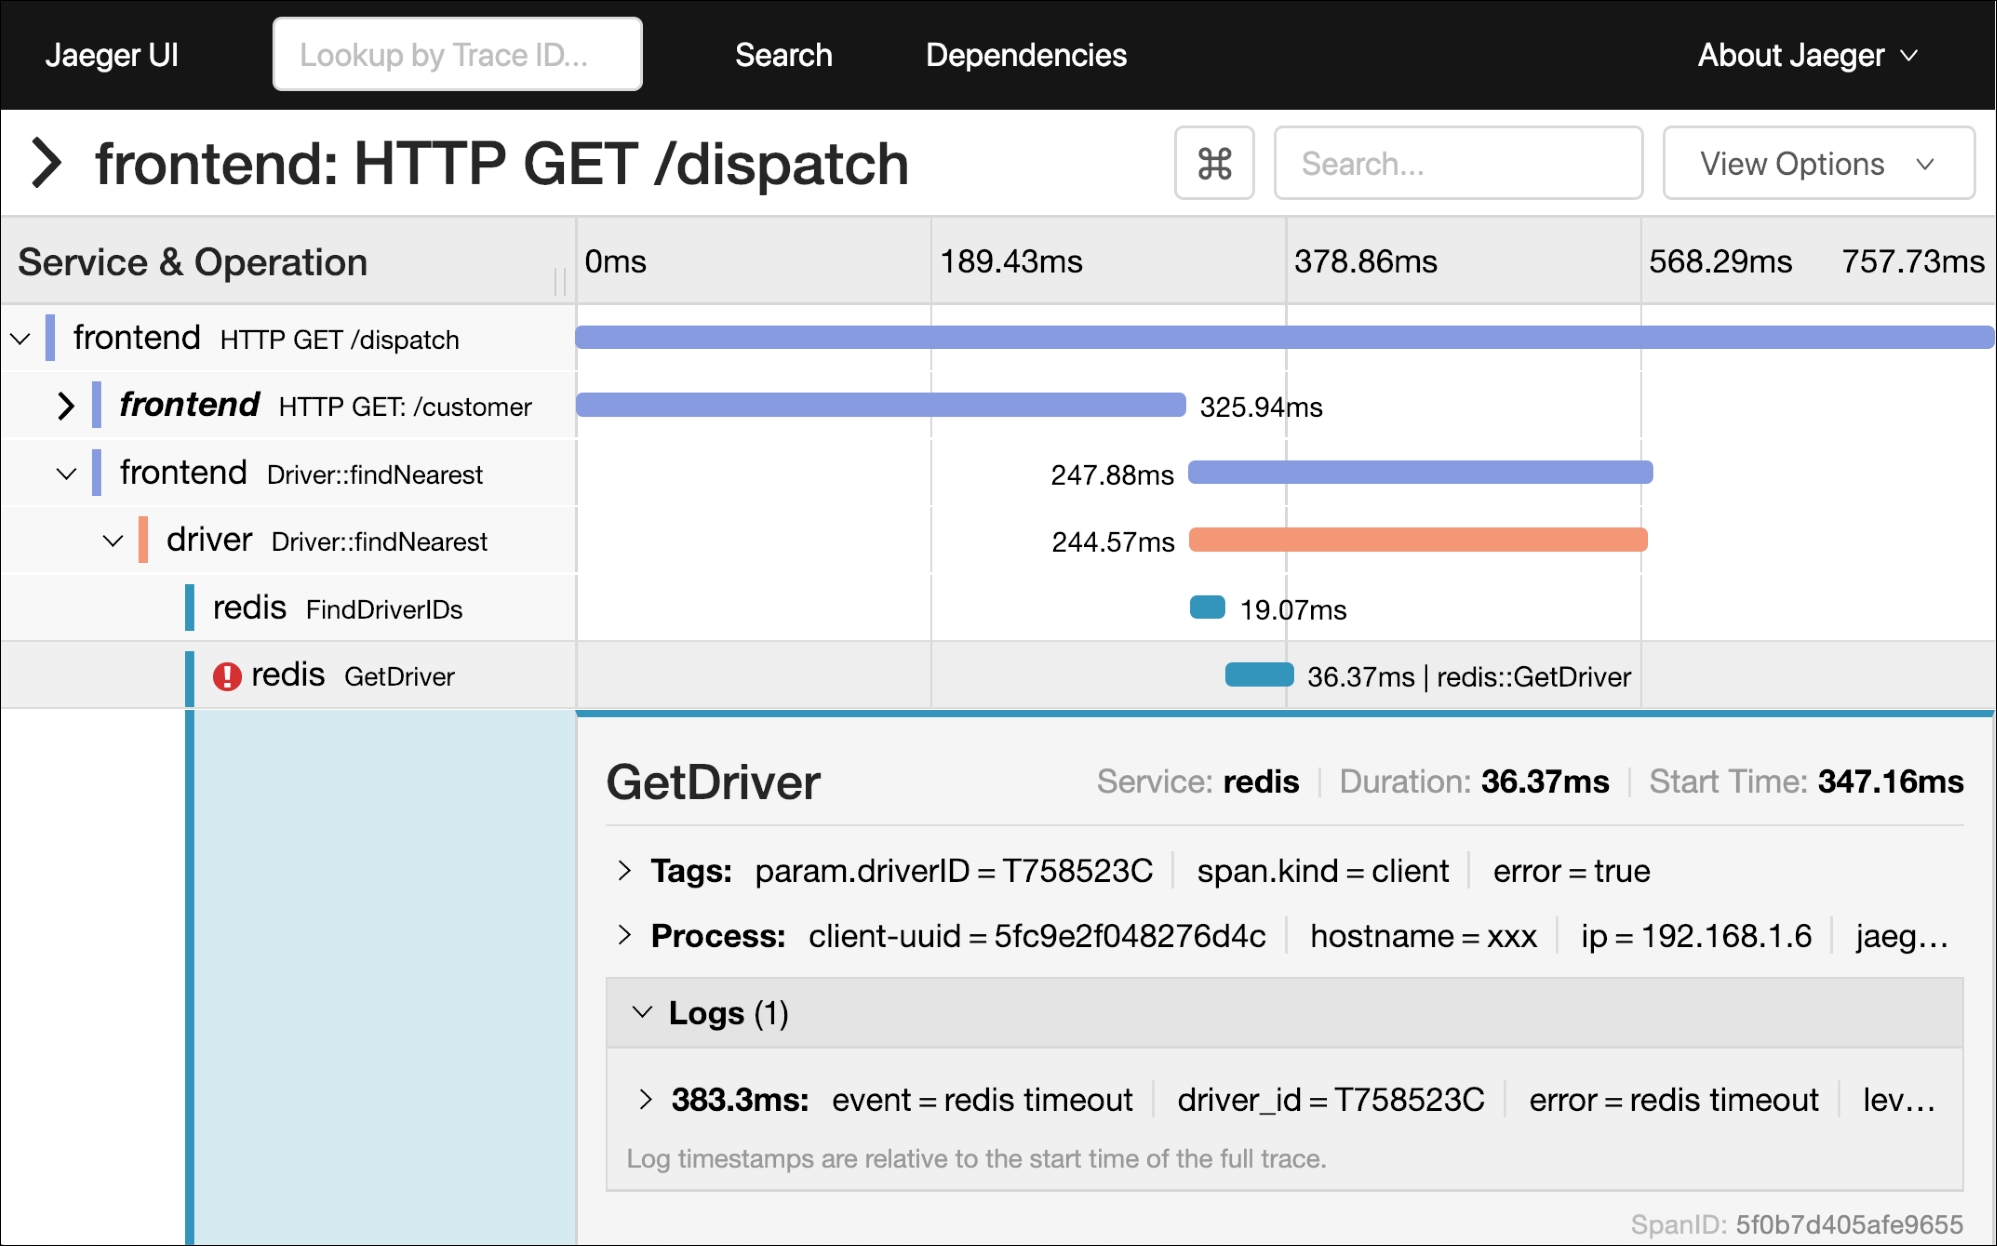
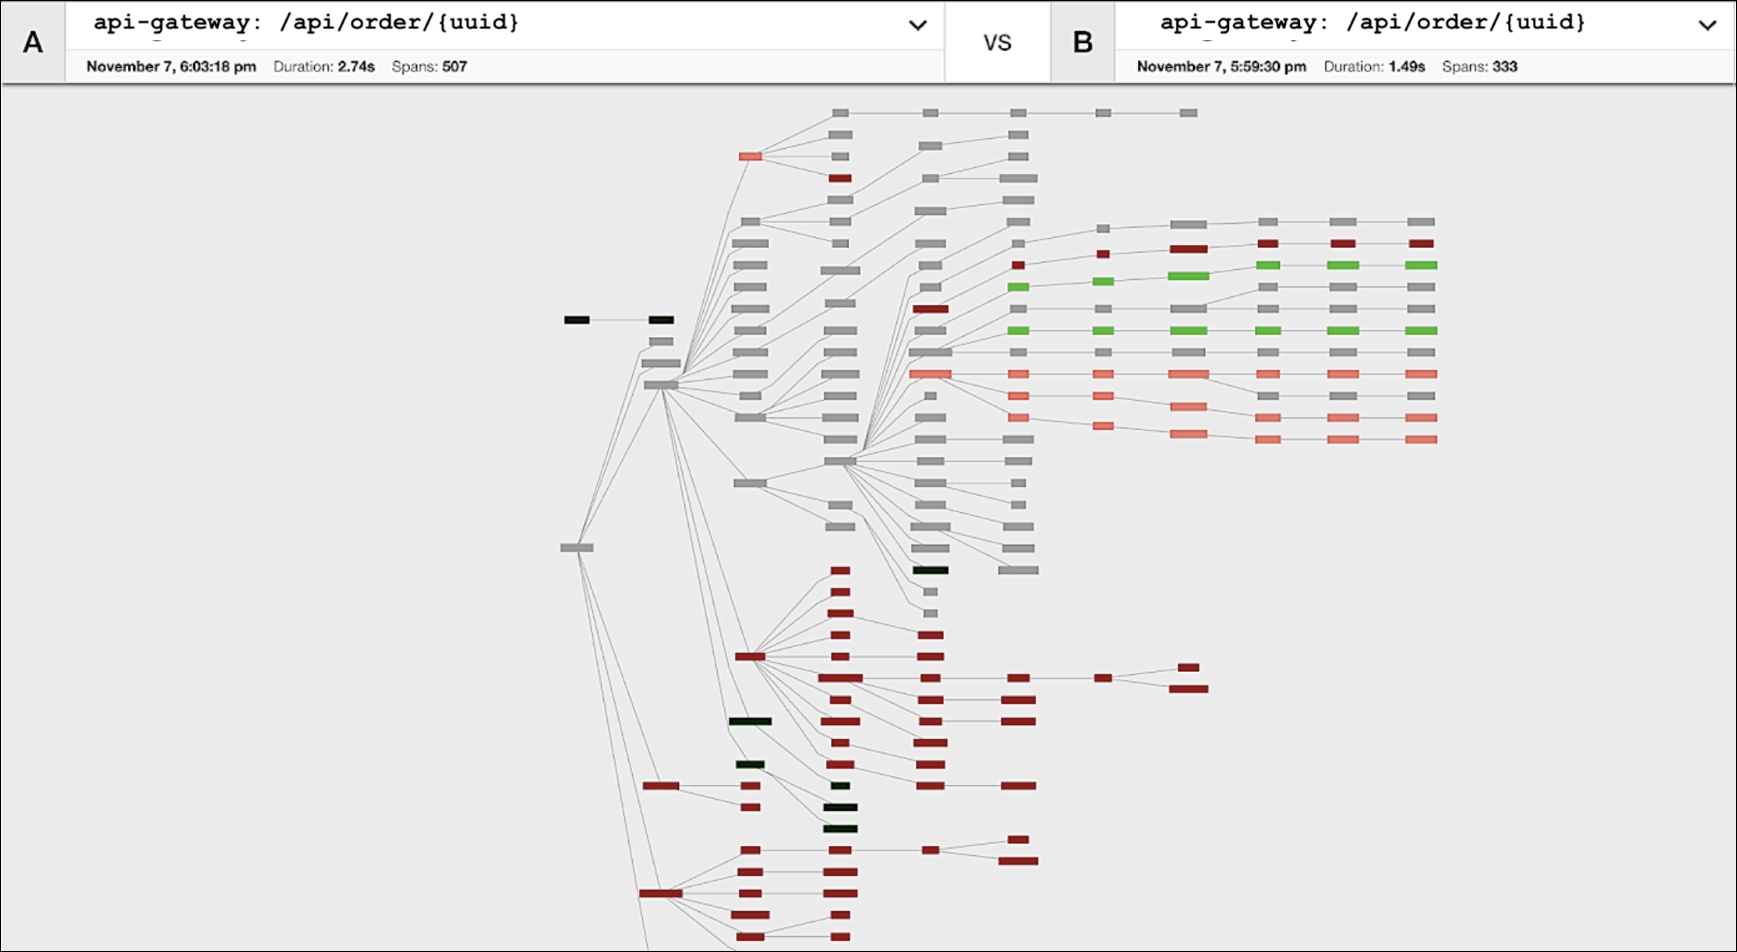
That deceptively simple technique allows the tracing infrastructure to reconstruct the whole path of the request, through the components of a distributed system, as a graph of events and causal edges between them, which we call a "trace." A trace allows us to reason about how the system was processing the request. Individual graphs can be aggregated and clustered to infer patterns of behaviors in the system. Traces can be displayed using various forms of visualizations, including Gantt charts (Figure 1.7) and graph representations (Figure 1.8), to give our visual cortex cues to finding the root cause of performance problems:

Figure 1.7: Jaeger UI view of a single request to the HotROD application, further discussed in chapter 2. In the bottom half, one of the spans (named GetDriver from service redis, with a warning icon) is expanded to show additional information, such as tags and span logs.

Figure 1.8: Jaeger UI view of two traces A and B being compared structurally in the graph form (best viewed in color). Light/dark green colors indicate services that were encountered more/only in trace B, and light/dark red colors indicate services encountered more/only in trace A.
By taking a request-centric view, tracing helps to illuminate different behaviors of the system. Of course, as Bryan Cantrill said in his KubeCon talk, just because we have tracing, it doesn't mean that we eliminated performance pathologies in our applications. We actually need to know how to use it to ask sophisticated questions that we now can ask with this powerful tool. Fortunately, distributed tracing is able to answer all the questions we posed in The observability challenge of microservices section.


