

In order to analyze packets to troubleshoot connectivity, performance, or security issues, you have to successfully capture all of the right packets and then identify and filter out just the packets that pertain to the goal at hand.
In this chapter, we will cover the following topics:
- Picking the best capture point
- TAPs and switch port mirroring
- Wireshark's capture interfaces, filters, and options
- Verifying a good capture
- Isolating the conversation(s) of interest
- Using the Wireshark Conversations window
- Wireshark's display filters
- Filtering expression buttons
- Following TCP/UDP/SSL streams
- Marking and ignoring packets
- Saving filtered traffic
You'll recognize that many of these activities are the same ones that we accomplished in Chapter 1, Getting Acquainted with Wireshark, to perform a capture and filter just the packets involved in loading a web page. In this chapter, we'll expand and finish rounding out your skills in all these topics.
Determining the best location to perform a packet capture depends on several considerations:
If you're troubleshooting a user complaint, the first capture point should be at the user's workstation to gain a view from the user's perspective and verify/clarify the situation that the user is reporting. From this vantage point, you can:
- Ensure that basic network services such as ARP and DNS are working correctly
- Analyze the initial login process if the user authentication involves a different device than the target application server
- Measure network round trip times from the user to the target host(s)
- Determine whether the TCP session setup handshake is appropriate for the application being accessed
- Measure service response times (such as HTTP or SMB response times)
- Determine whether the user is experiencing packet loss and retransmissions, out-of-order packets, or other network-related anomalies
- Capture any application error messages being sent to the user and the requests that resulted in those errors
Capturing from a user's location is usually much simpler from a practical standpoint and there is a lot less traffic to deal with, which makes capture sizes smaller and filtering the packets of interest simpler. Disconnecting a user's Ethernet cable for a few minutes to insert a TAP (we'll discuss these in the next section) or installing Wireshark on the user's workstation does not typically require special authorization or preparation as the risk to other users is negligible.
If a capture from a complaining user's workstation isn't possible or practical, a capture from the server end can still be useful, but it might be advantageous to apply a capture filter to gather just the traffic to/from the user's workstation (based on the user's IP address) to limit the capture file size. You can still measure network round trip times, server response times, analyze TCP handshake details, and detect retransmissions caused by packet loss, and perhaps the login/authentication process from this location.
Capturing from a server location is also appropriate when analyzing backend service response times. For example, if users interact with an application server but that app server performs transactions with a backend database in order to fulfill user requests and if there are complaints of slow response times, then an analysis of application server-to-database server interactions can help isolate the true source of the poor performance to one or the other host and the types of requests that result in slow or erroneous responses.
For the majority of packet captures, you'll likely be at user workstations or server switch ports, but there will also be some cases where captures will need to be performed at other locations.
Identifying the source of excessive packet loss or disordering over a network path may require performing packet captures at various points along that path, typically at distribution or core switch trunks, or interfaces to routers, firewalls, and so on, to find the network segment where packet loss becomes apparent.
Today's modern networks often employ a number of network devices that can actually alter the contents of packets flowing between clients and servers; in some (occasional or last resort) cases, it may be necessary to capture on both sides of these devices to isolate or prove a functional or configuration problem:
- Routers and gateways: These are also called Internet gateways in some configurations and may be configured to perform a Network Address Translation (NAT) function that alters and hides the user's actual IP address from an outside network. This is done by substituting a public IP address for the user's real address. This usually involves translating port numbers as well so that a single public IP address can be used to support multiple sessions; in which case, the solution is called Port Address Translation (PAT). The end result of the PAT functionality is that a capture from the client side and a capture at the server side of the same session conversation will involve different IP addresses and port numbers.
The following diagram illustrates how a PAT device translates IP addresses and ports from an internal private network to and from an externally visible IP address and has translated the ports used for an individual user session:

- Proxy servers and firewalls: Devices such as these can act as an intermediary between clients wanting to use resources from other (usually external) servers. These devices are most typically deployed between users inside a company and outside (web) services accessed via the Internet. These devices are employed for their security capabilities, allowing administrative control over what can be accessed and the type of data content that can be relayed between the two networks, malware scanning, and so on. From a packet analysis standpoint, you should be aware that in addition to performing a NAT/PAT function, some implementations of these devices may actually terminate a user session on one side and initiate a completely different session between the device and the outside host on the other side, on behalf of the user, such that the TCP handshake and session parameters, IP addresses and port numbers, and packet sizes can all differ on either side.
- IP tunnels using Generic Routing Encapsulation: These are used to connect two IP networks that don't otherwise have a native routing path to each other. The original packets are encapsulated inside packets with different IP addresses appropriate for the network media that they will traverse. The most common use of IP tunneling is to connect private corporate networks together through public Internet connections or to connect Internet Protocol Version 6 (IPv6) networks together over traditional IPv4 network paths. IP tunnels can be configured between routers and high-end switches.
Although it may be necessary (to validate an issue to other support teams) or more practical to capture at or near the interfaces to the devices described earlier, it is usually easier and just as effective to perform the captures at user and/or server locations. Unless you're part of a network support team, you won't have to conduct an analysis in such an advanced and complicated environment.
If you're capturing from a user location and cannot or do not wish to install Wireshark on the user's machine or you're capturing at another location in the network, you have two options to obtain a copy of the packets traversing the network: Test Access Ports or switch port mirroring.
A Test Access Port (TAP) is a device that copies all the packets flowing through it to one or more monitor ports. A station with Wireshark installed on it can be connected to one of the monitor ports to capture the packets.
You should select an aggregating TAP that supports the link speed of the network ports being analyzed (usually 100 Mbps or 1 Gbps) and that will copy and combine the packets flowing in both directions (transmit data from the user's workstation and receive data from the network); the aggregating TAP funnels the traffic to a single connection (transmit to the Wireshark station) so that you can capture the traffic in both directions with a single network interface on the Wireshark station. Be aware that since you're copying packets from two directions into one pipe to the Wireshark station, it is possible to oversubscribe the monitor port if traffic rates are extremely high. If this happens, the excess packets will be dropped. Oversubscription usually isn't a concern at user workstations, but it could be for switch trunks or other high traffic areas.
The following figure illustrates how a TAP is inserted between a user workstation and that workstation's switch port, and how a Wireshark workstation is attached to capture packets:
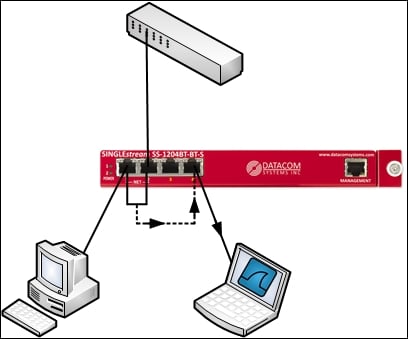
Switch port mirroring, also known as a Switched Port Analyzer (SPAN) feature or spanning a port, is the practice of configuring a network switch to perform the same function as a TAP: to make a copy of the packets flowing in and out of a specified port and send them to an otherwise unused monitor port where a Wireshark station is attached to capture the packets.
The advantage of using port mirroring is that no connections need to be broken to insert a TAP. The monitor port can be easily configured by a switch administrator and just as easily disabled.
The potential issues with this option include the fact that not all switches support port mirroring, and there is some evidence to suggest that using this feature can affect the performance of the switch, at least for the port being monitored. The possibility of oversubscribing the monitor port from excessive transmit plus receiving traffic levels also exists for port mirroring, as is the case when using a TAP, and this is likely when monitoring switch trunks to other switches, as these will be carrying traffic for multiple users.
The following diagram is a simple illustration of a port mirroring scenario on a switch. The packets to and from the workstation port are copied to the port where the Wireshark station is connected.

If you need to capture packets on a high traffic rate link such as a trunk link between larger switches, Wireshark is probably not the best solution. It may not be able to keep up with a busy link. Wireshark is actually a GUI tool that calls a command-line executable called dumpcap, which captures the packets and saves them to a disk file. Wireshark reads this file and presents the processed packets to the user interface. An alternative to Wireshark is to use the dumpcap or tcpdump executable directly (these are covered in Chapter 8, Command-line and Other Utilities) or a high performance capture appliance offered by numerous vendors.
Test Access Port
A Test Access Port (TAP) is a device that copies all the packets flowing through it to one or more monitor ports. A station with Wireshark installed on it can be connected to one of the monitor ports to capture the packets.
You should select an aggregating TAP that supports the link speed of the network ports being analyzed (usually 100 Mbps or 1 Gbps) and that will copy and combine the packets flowing in both directions (transmit data from the user's workstation and receive data from the network); the aggregating TAP funnels the traffic to a single connection (transmit to the Wireshark station) so that you can capture the traffic in both directions with a single network interface on the Wireshark station. Be aware that since you're copying packets from two directions into one pipe to the Wireshark station, it is possible to oversubscribe the monitor port if traffic rates are extremely high. If this happens, the excess packets will be dropped. Oversubscription usually isn't a concern at user workstations, but it could be for switch trunks or other high traffic areas.
The following figure illustrates how a TAP is inserted between a user workstation and that workstation's switch port, and how a Wireshark workstation is attached to capture packets:
Switch port mirroring, also known as a Switched Port Analyzer (SPAN) feature or spanning a port, is the practice of configuring a network switch to perform the same function as a TAP: to make a copy of the packets flowing in and out of a specified port and send them to an otherwise unused monitor port where a Wireshark station is attached to capture the packets.
The advantage of using port mirroring is that no connections need to be broken to insert a TAP. The monitor port can be easily configured by a switch administrator and just as easily disabled.
The potential issues with this option include the fact that not all switches support port mirroring, and there is some evidence to suggest that using this feature can affect the performance of the switch, at least for the port being monitored. The possibility of oversubscribing the monitor port from excessive transmit plus receiving traffic levels also exists for port mirroring, as is the case when using a TAP, and this is likely when monitoring switch trunks to other switches, as these will be carrying traffic for multiple users.
The following diagram is a simple illustration of a port mirroring scenario on a switch. The packets to and from the workstation port are copied to the port where the Wireshark station is connected.
If you need to capture packets on a high traffic rate link such as a trunk link between larger switches, Wireshark is probably not the best solution. It may not be able to keep up with a busy link. Wireshark is actually a GUI tool that calls a command-line executable called dumpcap, which captures the packets and saves them to a disk file. Wireshark reads this file and presents the processed packets to the user interface. An alternative to Wireshark is to use the dumpcap or tcpdump executable directly (these are covered in Chapter 8, Command-line and Other Utilities) or a high performance capture appliance offered by numerous vendors.
Switch port mirroring
Switch port mirroring, also known as a Switched Port Analyzer (SPAN) feature or spanning a port, is the practice of configuring a network switch to perform the same function as a TAP: to make a copy of the packets flowing in and out of a specified port and send them to an otherwise unused monitor port where a Wireshark station is attached to capture the packets.
The advantage of using port mirroring is that no connections need to be broken to insert a TAP. The monitor port can be easily configured by a switch administrator and just as easily disabled.
The potential issues with this option include the fact that not all switches support port mirroring, and there is some evidence to suggest that using this feature can affect the performance of the switch, at least for the port being monitored. The possibility of oversubscribing the monitor port from excessive transmit plus receiving traffic levels also exists for port mirroring, as is the case when using a TAP, and this is likely when monitoring switch trunks to other switches, as these will be carrying traffic for multiple users.
The following diagram is a simple illustration of a port mirroring scenario on a switch. The packets to and from the workstation port are copied to the port where the Wireshark station is connected.
If you need to capture packets on a high traffic rate link such as a trunk link between larger switches, Wireshark is probably not the best solution. It may not be able to keep up with a busy link. Wireshark is actually a GUI tool that calls a command-line executable called dumpcap, which captures the packets and saves them to a disk file. Wireshark reads this file and presents the processed packets to the user interface. An alternative to Wireshark is to use the dumpcap or tcpdump executable directly (these are covered in Chapter 8, Command-line and Other Utilities) or a high performance capture appliance offered by numerous vendors.
Capturing packets on high traffic rate links
If you need to capture packets on a high traffic rate link such as a trunk link between larger switches, Wireshark is probably not the best solution. It may not be able to keep up with a busy link. Wireshark is actually a GUI tool that calls a command-line executable called dumpcap, which captures the packets and saves them to a disk file. Wireshark reads this file and presents the processed packets to the user interface. An alternative to Wireshark is to use the dumpcap or tcpdump executable directly (these are covered in Chapter 8, Command-line and Other Utilities) or a high performance capture appliance offered by numerous vendors.
Capturing packets with Wireshark consists of selecting the correct network interface to capture packets from, applying any capture filters that may be appropriate, and applying the correct options to accomplish the capture in the desired manner. We'll cover these three topics in the following sections.
As discussed in Chapter 1, Getting Acquainted with Wireshark, if you have multiple network interfaces on your machine, you need to determine and select the correct interface to capture packets. In Wireshark's Capture menu, click on Interface or click on the first icon on the icon bar.
The Wireshark Capture Interfaces window provides a list and description of the network interfaces on your machine, the IP addresses assigned, and the total packets and packets per second counters for each interface. If an interface has an IPv6 address assigned and this is being displayed, you can click on the address to toggle and display the IPv4 address.
The following screenshot illustrates a typical Capture Interfaces window listing a LAN and wireless interface along with their IP addresses and packet counters:

The Capture Interfaces window provides the following two options:
- Clicking on the Details button for any of the listed interfaces opens an Interface Details window that provides a wide range of information that can be useful to verify the interface's operation. The status of the Link and Link Speed information is displayed in the Characteristics tab, and the MAC address of the selected NIC is displayed in the 802.3 (Ethernet) tab.
- The rest of the capture options are configured in the Capture Options window, which is opened by clicking on the Options button in the Capture Interfaces window, or by selecting Options from the Capture menu, or by clicking on the second icon in the icon bar.
The following screenshot illustrates a typical Capture Options window with a number of options specified. You can refer to it for examples of the topics on Capture Options.

As seen in the preceding screenshot, the Capture Options window displays the available interfaces and their IP addresses and allows you to select one or more of these interfaces to perform the capture. Wireshark can capture from multiple interfaces simultaneously, as well as from virtual interfaces. The primary advantage of starting with the Capture Interfaces window is the availability of the packet counters to aid in identifying active interfaces, a feature not available in the Capture Options window. Otherwise, if you know which interface you'll want to use, you can skip using the Capture Interfaces window and start here.
Clicking on the Manage Interfaces button in the Capture Options window brings up an Interface Management window. From the Local Interfaces tab, you can select to hide interfaces that you do not wish to see displayed in the Capture Interfaces and Capture Options windows.
There is an option to quickly enable Capture on all interfaces and a Use promiscuous mode on all interfaces option that is enabled by default. In most cases, this option should be left enabled so that the chosen interface(s) can capture and save all the packets seen. Otherwise, only the packets that are being sent to the Wireshark workstation's MAC address, broadcast, and/or multicast packets will be seen and captured, which basically negates its usefulness as a capture device. The Compile selected BPFs button provides a machine language display of the compiled capture filter, but has no other functional purpose.
Capture filters are used to reduce the amount of traffic saved during a packet capture. In practice, capture filters should be used sparingly, if used at all, to help make sure that no packets that are important for an analysis are inadvertently missed because they fall outside the capture filter parameters. Remember that you can always filter out unwanted traffic from a capture, but you can't do anything about missed packets once the capture is finished. If you're unsure about a capture, perform the capture again with a more generous capture filter or none at all.
One scenario where a capture filter is appropriate is when you want to let a capture run for a long period of time. Then, you should filter out as much extraneous traffic as possible to keep capture file sizes under control. However, take care to make sure the capture filter you apply doesn't exclude any traffic that may be useful for the analysis.
It's usually a good idea to do some trial captures when using capture filters to verify that the filter is working as desired before doing the official capture that you want to keep.
Wireshark provides a Capture Filter window that makes it easy to select a preconfigured capture filter, or you can configure your own based on your needs.
Click on the Capture Filter button in the Capture Options window to open the Capture Filters window. From this window, you can select from a number of useful preconfigured capture filters, create a new and unique capture filter for your purposes, or delete unwanted or erroneous filters. Creating a new filter only involves giving the filter a name, entering the capture filter syntax, clicking on New to save the filter, and then finally clicking on OK. Alternatively, you can click on an existing filter and then click on New, which will create a copy of that filter at the bottom of the list that can then be modified for your purposes.
The following screenshot illustrates a typical Capture Filter window. In this case, a capture filter that will only allow traffic to and from a specific Ethernet MAC address has been selected:
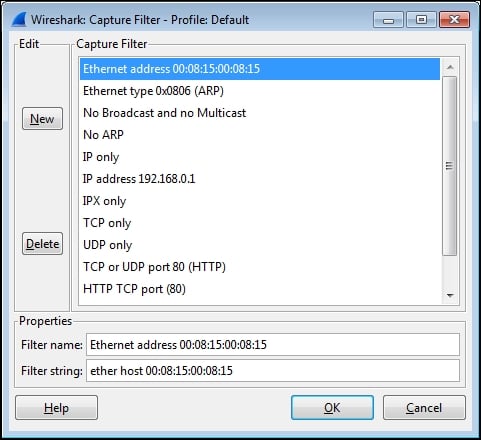
Wireshark's capture filters use a syntax that is known as the Berkley Packet Filter (BPF) format, which has legacy roots in the Unix world and is still in use today with packet-level drivers. Note that the syntax used to capture filters in Wireshark differs significantly from the syntax used for display filters.
The default selection of capture filters from the Capture Filter window is helpful in providing examples of capture filter syntax. Some additional examples of capture filter syntax and examples of that syntax are outlined in the following table:
|
Description |
Syntax |
Examples |
|---|---|---|
|
Filter on an Ethernet MAC address Filter to capture just the traffic from or to a MAC address |
ether host ether |
ether host ether |
|
Filter on an IP address or hostname Filter to capture just the traffic between two IP addresses Filter traffic in one direction only between two hosts |
host
|
|
|
Filter based on a port number Filter for DNS packets Filter for DHCP packets |
|
|
|
Filter based on a protocol Filter for HTTP traffic only |
|
|
|
Capture filter logical operators Filter to exclude ARP and DNS packets |
|
|
More information and examples of capture filters can be found on the Wireshark wiki at http://wiki.wireshark.org/CaptureFilters and the protocol-specific capture filter syntax is included in the reference information found at http://wiki.wireshark.org/ProtocolReference.
The Wireshark Capture Options window offers a variety of controls to configure captures to suit a particular need.
Clicking on the Browse button on the File option allows you to navigate to a chosen directory in which you can store the capture files and enter a filename for the capture files.
When the
File option is used, Wireshark will append a file number and date-time stamp to the filename you specify and will not provide a file extension. You should specify a .pcapng extension in the filename. This is better illustrated with an example.
The user provided directory and filename is C:\Wireshark\long_capture.pcapng, and Wireshark will create and save packets to files in the format C:\Wireshark\long_capture_00001_20140724132952.pcapng.
If Wireshark is configured to capture to more than one file (this will be discussed later), the file numbers and date-time stamps will be incremented accordingly as the capture progresses, for example, long_capture_00002_20140724133343.pcapng and long_capture_00003_20140724133612.pcapng.
Wireshark can be configured to save packets to multiple files to allow long-term captures, and offers a number of options to control how this is accomplished.
Selecting the Use multiple files option causes the appropriate underlying controls to become active as specific options are enabled. You can choose to start a new (next) file when each file reaches a given size and/or after a configurable period.
The Ring buffer option works in conjunction with the Next File every option to cause Wireshark to fill the specified number of files, and as the capture continues to progress, it deletes the oldest files.
This feature is useful to keep a capture running while waiting for some intermittent problem or an event to occur, after which the capture is manually stopped. The ring buffer files provide historical capture data for a period just prior to stopping the capture, without filling a hard drive with an excessive number of large capture files.
Wireshark has options to automatically stop a capture after a specified number of packets, file size, or time period. If the Use multiple files option is enabled, an option to stop the capture after a specified number of files can be employed. Otherwise, the capture can be stopped after a specified number of packets, file size, or time period has elapsed.
The Update list of packets in real time option specifies that Wireshark is to periodically read the capture file as it is being written during the capture and update the Packet List contents accordingly. Otherwise, the Wireshark user interface will be grayed out during the capture.
The Automatically scroll during live capture option specifies that Wireshark updates and displays the latest captured packets in the Packet List pane such that the packets seem to scroll up as the list is updated. The Update list of packets in real time option must be enabled for this option to function.
Both of these options have a processing time cost that could result in lost packets and/or a sluggish display and should be disabled if capturing on a very busy link. However, the ability to view and confirm that the expected packet flows are occurring during the capture will be lost.
The Hide capture info dialog option (which is enabled by default) controls whether a simple window is displayed during the capture that displays the packet counts and percentages by protocol. Unless specifically needed, it is best to leave this window hidden.
If the
Resolve MAC addresses option is enabled, it causes Wireshark to display MAC addresses with an assigned manufacturer code in place of the first three octets. For example, Wireshark will display CiscoCon_21:b7:ec instead of c8:d7:19:21:b7:ec. The list of manufacturer's codes is kept in the manuf file of the Wireshark installation directory.
The Resolve network-layer names option works in conjunction with Use external network name resolver to determine if or how captured IP addresses are resolved into their hostnames, as follows:
- The Resolve network-layer names option specifies that Wireshark should attempt to resolve IP addresses into hostnames. If the Use external network name resolver option is enabled, Wireshark will perform reverse DNS lookups for each unique IP address. This causes Wireshark to generate traffic of its own.
- If the Use external network name resolver option is disabled, Wireshark will attempt to resolve the IP addresses using a
hoststext file provided by a user (which uses typical IP address<tab>hostname syntax) located in the Wireshark installation directory when using a default profile or in the appropriate profile directory when using a custom profile.
During a capture, it is better to leave the Resolve network-layer names option disabled so that Wireshark isn't creating additional network traffic while trying to resolve IP addresses during a capture. This feature can always be temporarily enabled (by navigating to View | Name Resolution | Enable for network layer from the menu) after the capture is finished.
If the Resolve transport-layer name option is enabled, it causes Wireshark to display the human-readable, port- and protocol-specific services' names instead of the port numbers in the Info display field in the Packet List pane. For example, TCP port 80 will be displayed as HTTP. The list of port number services is kept in the services file in the Wireshark installation directory.
The screenshot at the beginning of this section illustrates a Capture Option window set to use the LAN interface, a filter to capture traffic only to and from a specific Ethernet MAC address, to save up to five files of 100 MB each in a ring buffer scenario, and to save those files in a provided directory with a specific leading filename and extension. The Display Options and Name Resolution options have been left in their default settings.
Once all the desired Capture Options have been selected, clicking on the Start button will start the capture.
Having covered all the most useful Capture Options features, now is probably the right time to tell you that for many of your captures, especially from a relatively low traffic volume location such as from a user workstation, you don't want or need to set any capture options (except the appropriate interface to capture from) and can simply jump into starting a capture using all the defaults by clicking on the third (green shark-fin shaped) icon on the icon bar or selecting Start from the Capture menu. Not using a capture filter allows you to capture all the relevant packets—without missing anything—and filter any unwanted traffic out using display filters after the capture is done.
Selecting the correct network interface
As discussed in Chapter 1, Getting Acquainted with Wireshark, if you have multiple network interfaces on your machine, you need to determine and select the correct interface to capture packets. In Wireshark's Capture menu, click on Interface or click on the first icon on the icon bar.
The Wireshark Capture Interfaces window provides a list and description of the network interfaces on your machine, the IP addresses assigned, and the total packets and packets per second counters for each interface. If an interface has an IPv6 address assigned and this is being displayed, you can click on the address to toggle and display the IPv4 address.
The following screenshot illustrates a typical Capture Interfaces window listing a LAN and wireless interface along with their IP addresses and packet counters:
The Capture Interfaces window provides the following two options:
- Clicking on the Details button for any of the listed interfaces opens an Interface Details window that provides a wide range of information that can be useful to verify the interface's operation. The status of the Link and Link Speed information is displayed in the Characteristics tab, and the MAC address of the selected NIC is displayed in the 802.3 (Ethernet) tab.
- The rest of the capture options are configured in the Capture Options window, which is opened by clicking on the Options button in the Capture Interfaces window, or by selecting Options from the Capture menu, or by clicking on the second icon in the icon bar.
The following screenshot illustrates a typical Capture Options window with a number of options specified. You can refer to it for examples of the topics on Capture Options.
As seen in the preceding screenshot, the Capture Options window displays the available interfaces and their IP addresses and allows you to select one or more of these interfaces to perform the capture. Wireshark can capture from multiple interfaces simultaneously, as well as from virtual interfaces. The primary advantage of starting with the Capture Interfaces window is the availability of the packet counters to aid in identifying active interfaces, a feature not available in the Capture Options window. Otherwise, if you know which interface you'll want to use, you can skip using the Capture Interfaces window and start here.
Clicking on the Manage Interfaces button in the Capture Options window brings up an Interface Management window. From the Local Interfaces tab, you can select to hide interfaces that you do not wish to see displayed in the Capture Interfaces and Capture Options windows.
There is an option to quickly enable Capture on all interfaces and a Use promiscuous mode on all interfaces option that is enabled by default. In most cases, this option should be left enabled so that the chosen interface(s) can capture and save all the packets seen. Otherwise, only the packets that are being sent to the Wireshark workstation's MAC address, broadcast, and/or multicast packets will be seen and captured, which basically negates its usefulness as a capture device. The Compile selected BPFs button provides a machine language display of the compiled capture filter, but has no other functional purpose.
Capture filters are used to reduce the amount of traffic saved during a packet capture. In practice, capture filters should be used sparingly, if used at all, to help make sure that no packets that are important for an analysis are inadvertently missed because they fall outside the capture filter parameters. Remember that you can always filter out unwanted traffic from a capture, but you can't do anything about missed packets once the capture is finished. If you're unsure about a capture, perform the capture again with a more generous capture filter or none at all.
One scenario where a capture filter is appropriate is when you want to let a capture run for a long period of time. Then, you should filter out as much extraneous traffic as possible to keep capture file sizes under control. However, take care to make sure the capture filter you apply doesn't exclude any traffic that may be useful for the analysis.
It's usually a good idea to do some trial captures when using capture filters to verify that the filter is working as desired before doing the official capture that you want to keep.
Wireshark provides a Capture Filter window that makes it easy to select a preconfigured capture filter, or you can configure your own based on your needs.
Click on the Capture Filter button in the Capture Options window to open the Capture Filters window. From this window, you can select from a number of useful preconfigured capture filters, create a new and unique capture filter for your purposes, or delete unwanted or erroneous filters. Creating a new filter only involves giving the filter a name, entering the capture filter syntax, clicking on New to save the filter, and then finally clicking on OK. Alternatively, you can click on an existing filter and then click on New, which will create a copy of that filter at the bottom of the list that can then be modified for your purposes.
The following screenshot illustrates a typical Capture Filter window. In this case, a capture filter that will only allow traffic to and from a specific Ethernet MAC address has been selected:
Wireshark's capture filters use a syntax that is known as the Berkley Packet Filter (BPF) format, which has legacy roots in the Unix world and is still in use today with packet-level drivers. Note that the syntax used to capture filters in Wireshark differs significantly from the syntax used for display filters.
The default selection of capture filters from the Capture Filter window is helpful in providing examples of capture filter syntax. Some additional examples of capture filter syntax and examples of that syntax are outlined in the following table:
|
Description |
Syntax |
Examples |
|---|---|---|
|
Filter on an Ethernet MAC address Filter to capture just the traffic from or to a MAC address |
ether host ether |
ether host ether |
|
Filter on an IP address or hostname Filter to capture just the traffic between two IP addresses Filter traffic in one direction only between two hosts |
host
|
|
|
Filter based on a port number Filter for DNS packets Filter for DHCP packets |
|
|
|
Filter based on a protocol Filter for HTTP traffic only |
|
|
|
Capture filter logical operators Filter to exclude ARP and DNS packets |
|
|
More information and examples of capture filters can be found on the Wireshark wiki at http://wiki.wireshark.org/CaptureFilters and the protocol-specific capture filter syntax is included in the reference information found at http://wiki.wireshark.org/ProtocolReference.
The Wireshark Capture Options window offers a variety of controls to configure captures to suit a particular need.
Clicking on the Browse button on the File option allows you to navigate to a chosen directory in which you can store the capture files and enter a filename for the capture files.
When the
File option is used, Wireshark will append a file number and date-time stamp to the filename you specify and will not provide a file extension. You should specify a .pcapng extension in the filename. This is better illustrated with an example.
The user provided directory and filename is C:\Wireshark\long_capture.pcapng, and Wireshark will create and save packets to files in the format C:\Wireshark\long_capture_00001_20140724132952.pcapng.
If Wireshark is configured to capture to more than one file (this will be discussed later), the file numbers and date-time stamps will be incremented accordingly as the capture progresses, for example, long_capture_00002_20140724133343.pcapng and long_capture_00003_20140724133612.pcapng.
Wireshark can be configured to save packets to multiple files to allow long-term captures, and offers a number of options to control how this is accomplished.
Selecting the Use multiple files option causes the appropriate underlying controls to become active as specific options are enabled. You can choose to start a new (next) file when each file reaches a given size and/or after a configurable period.
The Ring buffer option works in conjunction with the Next File every option to cause Wireshark to fill the specified number of files, and as the capture continues to progress, it deletes the oldest files.
This feature is useful to keep a capture running while waiting for some intermittent problem or an event to occur, after which the capture is manually stopped. The ring buffer files provide historical capture data for a period just prior to stopping the capture, without filling a hard drive with an excessive number of large capture files.
Wireshark has options to automatically stop a capture after a specified number of packets, file size, or time period. If the Use multiple files option is enabled, an option to stop the capture after a specified number of files can be employed. Otherwise, the capture can be stopped after a specified number of packets, file size, or time period has elapsed.
The Update list of packets in real time option specifies that Wireshark is to periodically read the capture file as it is being written during the capture and update the Packet List contents accordingly. Otherwise, the Wireshark user interface will be grayed out during the capture.
The Automatically scroll during live capture option specifies that Wireshark updates and displays the latest captured packets in the Packet List pane such that the packets seem to scroll up as the list is updated. The Update list of packets in real time option must be enabled for this option to function.
Both of these options have a processing time cost that could result in lost packets and/or a sluggish display and should be disabled if capturing on a very busy link. However, the ability to view and confirm that the expected packet flows are occurring during the capture will be lost.
The Hide capture info dialog option (which is enabled by default) controls whether a simple window is displayed during the capture that displays the packet counts and percentages by protocol. Unless specifically needed, it is best to leave this window hidden.
If the
Resolve MAC addresses option is enabled, it causes Wireshark to display MAC addresses with an assigned manufacturer code in place of the first three octets. For example, Wireshark will display CiscoCon_21:b7:ec instead of c8:d7:19:21:b7:ec. The list of manufacturer's codes is kept in the manuf file of the Wireshark installation directory.
The Resolve network-layer names option works in conjunction with Use external network name resolver to determine if or how captured IP addresses are resolved into their hostnames, as follows:
- The Resolve network-layer names option specifies that Wireshark should attempt to resolve IP addresses into hostnames. If the Use external network name resolver option is enabled, Wireshark will perform reverse DNS lookups for each unique IP address. This causes Wireshark to generate traffic of its own.
- If the Use external network name resolver option is disabled, Wireshark will attempt to resolve the IP addresses using a
hoststext file provided by a user (which uses typical IP address<tab>hostname syntax) located in the Wireshark installation directory when using a default profile or in the appropriate profile directory when using a custom profile.
During a capture, it is better to leave the Resolve network-layer names option disabled so that Wireshark isn't creating additional network traffic while trying to resolve IP addresses during a capture. This feature can always be temporarily enabled (by navigating to View | Name Resolution | Enable for network layer from the menu) after the capture is finished.
If the Resolve transport-layer name option is enabled, it causes Wireshark to display the human-readable, port- and protocol-specific services' names instead of the port numbers in the Info display field in the Packet List pane. For example, TCP port 80 will be displayed as HTTP. The list of port number services is kept in the services file in the Wireshark installation directory.
The screenshot at the beginning of this section illustrates a Capture Option window set to use the LAN interface, a filter to capture traffic only to and from a specific Ethernet MAC address, to save up to five files of 100 MB each in a ring buffer scenario, and to save those files in a provided directory with a specific leading filename and extension. The Display Options and Name Resolution options have been left in their default settings.
Once all the desired Capture Options have been selected, clicking on the Start button will start the capture.
Having covered all the most useful Capture Options features, now is probably the right time to tell you that for many of your captures, especially from a relatively low traffic volume location such as from a user workstation, you don't want or need to set any capture options (except the appropriate interface to capture from) and can simply jump into starting a capture using all the defaults by clicking on the third (green shark-fin shaped) icon on the icon bar or selecting Start from the Capture menu. Not using a capture filter allows you to capture all the relevant packets—without missing anything—and filter any unwanted traffic out using display filters after the capture is done.
Using capture filters
Capture filters are used to reduce the amount of traffic saved during a packet capture. In practice, capture filters should be used sparingly, if used at all, to help make sure that no packets that are important for an analysis are inadvertently missed because they fall outside the capture filter parameters. Remember that you can always filter out unwanted traffic from a capture, but you can't do anything about missed packets once the capture is finished. If you're unsure about a capture, perform the capture again with a more generous capture filter or none at all.
One scenario where a capture filter is appropriate is when you want to let a capture run for a long period of time. Then, you should filter out as much extraneous traffic as possible to keep capture file sizes under control. However, take care to make sure the capture filter you apply doesn't exclude any traffic that may be useful for the analysis.
It's usually a good idea to do some trial captures when using capture filters to verify that the filter is working as desired before doing the official capture that you want to keep.
Wireshark provides a Capture Filter window that makes it easy to select a preconfigured capture filter, or you can configure your own based on your needs.
Click on the Capture Filter button in the Capture Options window to open the Capture Filters window. From this window, you can select from a number of useful preconfigured capture filters, create a new and unique capture filter for your purposes, or delete unwanted or erroneous filters. Creating a new filter only involves giving the filter a name, entering the capture filter syntax, clicking on New to save the filter, and then finally clicking on OK. Alternatively, you can click on an existing filter and then click on New, which will create a copy of that filter at the bottom of the list that can then be modified for your purposes.
The following screenshot illustrates a typical Capture Filter window. In this case, a capture filter that will only allow traffic to and from a specific Ethernet MAC address has been selected:
Wireshark's capture filters use a syntax that is known as the Berkley Packet Filter (BPF) format, which has legacy roots in the Unix world and is still in use today with packet-level drivers. Note that the syntax used to capture filters in Wireshark differs significantly from the syntax used for display filters.
The default selection of capture filters from the Capture Filter window is helpful in providing examples of capture filter syntax. Some additional examples of capture filter syntax and examples of that syntax are outlined in the following table:
|
Description |
Syntax |
Examples |
|---|---|---|
|
Filter on an Ethernet MAC address Filter to capture just the traffic from or to a MAC address |
ether host ether |
ether host ether |
|
Filter on an IP address or hostname Filter to capture just the traffic between two IP addresses Filter traffic in one direction only between two hosts |
host
|
|
|
Filter based on a port number Filter for DNS packets Filter for DHCP packets |
|
|
|
Filter based on a protocol Filter for HTTP traffic only |
|
|
|
Capture filter logical operators Filter to exclude ARP and DNS packets |
|
|
More information and examples of capture filters can be found on the Wireshark wiki at http://wiki.wireshark.org/CaptureFilters and the protocol-specific capture filter syntax is included in the reference information found at http://wiki.wireshark.org/ProtocolReference.
The Wireshark Capture Options window offers a variety of controls to configure captures to suit a particular need.
Clicking on the Browse button on the File option allows you to navigate to a chosen directory in which you can store the capture files and enter a filename for the capture files.
When the
File option is used, Wireshark will append a file number and date-time stamp to the filename you specify and will not provide a file extension. You should specify a .pcapng extension in the filename. This is better illustrated with an example.
The user provided directory and filename is C:\Wireshark\long_capture.pcapng, and Wireshark will create and save packets to files in the format C:\Wireshark\long_capture_00001_20140724132952.pcapng.
If Wireshark is configured to capture to more than one file (this will be discussed later), the file numbers and date-time stamps will be incremented accordingly as the capture progresses, for example, long_capture_00002_20140724133343.pcapng and long_capture_00003_20140724133612.pcapng.
Wireshark can be configured to save packets to multiple files to allow long-term captures, and offers a number of options to control how this is accomplished.
Selecting the Use multiple files option causes the appropriate underlying controls to become active as specific options are enabled. You can choose to start a new (next) file when each file reaches a given size and/or after a configurable period.
The Ring buffer option works in conjunction with the Next File every option to cause Wireshark to fill the specified number of files, and as the capture continues to progress, it deletes the oldest files.
This feature is useful to keep a capture running while waiting for some intermittent problem or an event to occur, after which the capture is manually stopped. The ring buffer files provide historical capture data for a period just prior to stopping the capture, without filling a hard drive with an excessive number of large capture files.
Wireshark has options to automatically stop a capture after a specified number of packets, file size, or time period. If the Use multiple files option is enabled, an option to stop the capture after a specified number of files can be employed. Otherwise, the capture can be stopped after a specified number of packets, file size, or time period has elapsed.
The Update list of packets in real time option specifies that Wireshark is to periodically read the capture file as it is being written during the capture and update the Packet List contents accordingly. Otherwise, the Wireshark user interface will be grayed out during the capture.
The Automatically scroll during live capture option specifies that Wireshark updates and displays the latest captured packets in the Packet List pane such that the packets seem to scroll up as the list is updated. The Update list of packets in real time option must be enabled for this option to function.
Both of these options have a processing time cost that could result in lost packets and/or a sluggish display and should be disabled if capturing on a very busy link. However, the ability to view and confirm that the expected packet flows are occurring during the capture will be lost.
The Hide capture info dialog option (which is enabled by default) controls whether a simple window is displayed during the capture that displays the packet counts and percentages by protocol. Unless specifically needed, it is best to leave this window hidden.
If the
Resolve MAC addresses option is enabled, it causes Wireshark to display MAC addresses with an assigned manufacturer code in place of the first three octets. For example, Wireshark will display CiscoCon_21:b7:ec instead of c8:d7:19:21:b7:ec. The list of manufacturer's codes is kept in the manuf file of the Wireshark installation directory.
The Resolve network-layer names option works in conjunction with Use external network name resolver to determine if or how captured IP addresses are resolved into their hostnames, as follows:
- The Resolve network-layer names option specifies that Wireshark should attempt to resolve IP addresses into hostnames. If the Use external network name resolver option is enabled, Wireshark will perform reverse DNS lookups for each unique IP address. This causes Wireshark to generate traffic of its own.
- If the Use external network name resolver option is disabled, Wireshark will attempt to resolve the IP addresses using a
hoststext file provided by a user (which uses typical IP address<tab>hostname syntax) located in the Wireshark installation directory when using a default profile or in the appropriate profile directory when using a custom profile.
During a capture, it is better to leave the Resolve network-layer names option disabled so that Wireshark isn't creating additional network traffic while trying to resolve IP addresses during a capture. This feature can always be temporarily enabled (by navigating to View | Name Resolution | Enable for network layer from the menu) after the capture is finished.
If the Resolve transport-layer name option is enabled, it causes Wireshark to display the human-readable, port- and protocol-specific services' names instead of the port numbers in the Info display field in the Packet List pane. For example, TCP port 80 will be displayed as HTTP. The list of port number services is kept in the services file in the Wireshark installation directory.
The screenshot at the beginning of this section illustrates a Capture Option window set to use the LAN interface, a filter to capture traffic only to and from a specific Ethernet MAC address, to save up to five files of 100 MB each in a ring buffer scenario, and to save those files in a provided directory with a specific leading filename and extension. The Display Options and Name Resolution options have been left in their default settings.
Once all the desired Capture Options have been selected, clicking on the Start button will start the capture.
Having covered all the most useful Capture Options features, now is probably the right time to tell you that for many of your captures, especially from a relatively low traffic volume location such as from a user workstation, you don't want or need to set any capture options (except the appropriate interface to capture from) and can simply jump into starting a capture using all the defaults by clicking on the third (green shark-fin shaped) icon on the icon bar or selecting Start from the Capture menu. Not using a capture filter allows you to capture all the relevant packets—without missing anything—and filter any unwanted traffic out using display filters after the capture is done.
Configuring capture filters
Wireshark provides a Capture Filter window that makes it easy to select a preconfigured capture filter, or you can configure your own based on your needs.
Click on the Capture Filter button in the Capture Options window to open the Capture Filters window. From this window, you can select from a number of useful preconfigured capture filters, create a new and unique capture filter for your purposes, or delete unwanted or erroneous filters. Creating a new filter only involves giving the filter a name, entering the capture filter syntax, clicking on New to save the filter, and then finally clicking on OK. Alternatively, you can click on an existing filter and then click on New, which will create a copy of that filter at the bottom of the list that can then be modified for your purposes.
The following screenshot illustrates a typical Capture Filter window. In this case, a capture filter that will only allow traffic to and from a specific Ethernet MAC address has been selected:
Wireshark's capture filters use a syntax that is known as the Berkley Packet Filter (BPF) format, which has legacy roots in the Unix world and is still in use today with packet-level drivers. Note that the syntax used to capture filters in Wireshark differs significantly from the syntax used for display filters.
The default selection of capture filters from the Capture Filter window is helpful in providing examples of capture filter syntax. Some additional examples of capture filter syntax and examples of that syntax are outlined in the following table:
|
Description |
Syntax |
Examples |
|---|---|---|
|
Filter on an Ethernet MAC address Filter to capture just the traffic from or to a MAC address |
ether host ether |
ether host ether |
|
Filter on an IP address or hostname Filter to capture just the traffic between two IP addresses Filter traffic in one direction only between two hosts |
host
|
|
|
Filter based on a port number Filter for DNS packets Filter for DHCP packets |
|
|
|
Filter based on a protocol Filter for HTTP traffic only |
|
|
|
Capture filter logical operators Filter to exclude ARP and DNS packets |
|
|
More information and examples of capture filters can be found on the Wireshark wiki at http://wiki.wireshark.org/CaptureFilters and the protocol-specific capture filter syntax is included in the reference information found at http://wiki.wireshark.org/ProtocolReference.
The Wireshark Capture Options window offers a variety of controls to configure captures to suit a particular need.
Clicking on the Browse button on the File option allows you to navigate to a chosen directory in which you can store the capture files and enter a filename for the capture files.
When the
File option is used, Wireshark will append a file number and date-time stamp to the filename you specify and will not provide a file extension. You should specify a .pcapng extension in the filename. This is better illustrated with an example.
The user provided directory and filename is C:\Wireshark\long_capture.pcapng, and Wireshark will create and save packets to files in the format C:\Wireshark\long_capture_00001_20140724132952.pcapng.
If Wireshark is configured to capture to more than one file (this will be discussed later), the file numbers and date-time stamps will be incremented accordingly as the capture progresses, for example, long_capture_00002_20140724133343.pcapng and long_capture_00003_20140724133612.pcapng.
Wireshark can be configured to save packets to multiple files to allow long-term captures, and offers a number of options to control how this is accomplished.
Selecting the Use multiple files option causes the appropriate underlying controls to become active as specific options are enabled. You can choose to start a new (next) file when each file reaches a given size and/or after a configurable period.
The Ring buffer option works in conjunction with the Next File every option to cause Wireshark to fill the specified number of files, and as the capture continues to progress, it deletes the oldest files.
This feature is useful to keep a capture running while waiting for some intermittent problem or an event to occur, after which the capture is manually stopped. The ring buffer files provide historical capture data for a period just prior to stopping the capture, without filling a hard drive with an excessive number of large capture files.
Wireshark has options to automatically stop a capture after a specified number of packets, file size, or time period. If the Use multiple files option is enabled, an option to stop the capture after a specified number of files can be employed. Otherwise, the capture can be stopped after a specified number of packets, file size, or time period has elapsed.
The Update list of packets in real time option specifies that Wireshark is to periodically read the capture file as it is being written during the capture and update the Packet List contents accordingly. Otherwise, the Wireshark user interface will be grayed out during the capture.
The Automatically scroll during live capture option specifies that Wireshark updates and displays the latest captured packets in the Packet List pane such that the packets seem to scroll up as the list is updated. The Update list of packets in real time option must be enabled for this option to function.
Both of these options have a processing time cost that could result in lost packets and/or a sluggish display and should be disabled if capturing on a very busy link. However, the ability to view and confirm that the expected packet flows are occurring during the capture will be lost.
The Hide capture info dialog option (which is enabled by default) controls whether a simple window is displayed during the capture that displays the packet counts and percentages by protocol. Unless specifically needed, it is best to leave this window hidden.
If the
Resolve MAC addresses option is enabled, it causes Wireshark to display MAC addresses with an assigned manufacturer code in place of the first three octets. For example, Wireshark will display CiscoCon_21:b7:ec instead of c8:d7:19:21:b7:ec. The list of manufacturer's codes is kept in the manuf file of the Wireshark installation directory.
The Resolve network-layer names option works in conjunction with Use external network name resolver to determine if or how captured IP addresses are resolved into their hostnames, as follows:
- The Resolve network-layer names option specifies that Wireshark should attempt to resolve IP addresses into hostnames. If the Use external network name resolver option is enabled, Wireshark will perform reverse DNS lookups for each unique IP address. This causes Wireshark to generate traffic of its own.
- If the Use external network name resolver option is disabled, Wireshark will attempt to resolve the IP addresses using a
hoststext file provided by a user (which uses typical IP address<tab>hostname syntax) located in the Wireshark installation directory when using a default profile or in the appropriate profile directory when using a custom profile.
During a capture, it is better to leave the Resolve network-layer names option disabled so that Wireshark isn't creating additional network traffic while trying to resolve IP addresses during a capture. This feature can always be temporarily enabled (by navigating to View | Name Resolution | Enable for network layer from the menu) after the capture is finished.
If the Resolve transport-layer name option is enabled, it causes Wireshark to display the human-readable, port- and protocol-specific services' names instead of the port numbers in the Info display field in the Packet List pane. For example, TCP port 80 will be displayed as HTTP. The list of port number services is kept in the services file in the Wireshark installation directory.
The screenshot at the beginning of this section illustrates a Capture Option window set to use the LAN interface, a filter to capture traffic only to and from a specific Ethernet MAC address, to save up to five files of 100 MB each in a ring buffer scenario, and to save those files in a provided directory with a specific leading filename and extension. The Display Options and Name Resolution options have been left in their default settings.
Once all the desired Capture Options have been selected, clicking on the Start button will start the capture.
Having covered all the most useful Capture Options features, now is probably the right time to tell you that for many of your captures, especially from a relatively low traffic volume location such as from a user workstation, you don't want or need to set any capture options (except the appropriate interface to capture from) and can simply jump into starting a capture using all the defaults by clicking on the third (green shark-fin shaped) icon on the icon bar or selecting Start from the Capture menu. Not using a capture filter allows you to capture all the relevant packets—without missing anything—and filter any unwanted traffic out using display filters after the capture is done.
Capture options
The Wireshark Capture Options window offers a variety of controls to configure captures to suit a particular need.
Clicking on the Browse button on the File option allows you to navigate to a chosen directory in which you can store the capture files and enter a filename for the capture files.
When the
File option is used, Wireshark will append a file number and date-time stamp to the filename you specify and will not provide a file extension. You should specify a .pcapng extension in the filename. This is better illustrated with an example.
The user provided directory and filename is C:\Wireshark\long_capture.pcapng, and Wireshark will create and save packets to files in the format C:\Wireshark\long_capture_00001_20140724132952.pcapng.
If Wireshark is configured to capture to more than one file (this will be discussed later), the file numbers and date-time stamps will be incremented accordingly as the capture progresses, for example, long_capture_00002_20140724133343.pcapng and long_capture_00003_20140724133612.pcapng.
Wireshark can be configured to save packets to multiple files to allow long-term captures, and offers a number of options to control how this is accomplished.
Selecting the Use multiple files option causes the appropriate underlying controls to become active as specific options are enabled. You can choose to start a new (next) file when each file reaches a given size and/or after a configurable period.
The Ring buffer option works in conjunction with the Next File every option to cause Wireshark to fill the specified number of files, and as the capture continues to progress, it deletes the oldest files.
This feature is useful to keep a capture running while waiting for some intermittent problem or an event to occur, after which the capture is manually stopped. The ring buffer files provide historical capture data for a period just prior to stopping the capture, without filling a hard drive with an excessive number of large capture files.
Wireshark has options to automatically stop a capture after a specified number of packets, file size, or time period. If the Use multiple files option is enabled, an option to stop the capture after a specified number of files can be employed. Otherwise, the capture can be stopped after a specified number of packets, file size, or time period has elapsed.
The Update list of packets in real time option specifies that Wireshark is to periodically read the capture file as it is being written during the capture and update the Packet List contents accordingly. Otherwise, the Wireshark user interface will be grayed out during the capture.
The Automatically scroll during live capture option specifies that Wireshark updates and displays the latest captured packets in the Packet List pane such that the packets seem to scroll up as the list is updated. The Update list of packets in real time option must be enabled for this option to function.
Both of these options have a processing time cost that could result in lost packets and/or a sluggish display and should be disabled if capturing on a very busy link. However, the ability to view and confirm that the expected packet flows are occurring during the capture will be lost.
The Hide capture info dialog option (which is enabled by default) controls whether a simple window is displayed during the capture that displays the packet counts and percentages by protocol. Unless specifically needed, it is best to leave this window hidden.
If the
Resolve MAC addresses option is enabled, it causes Wireshark to display MAC addresses with an assigned manufacturer code in place of the first three octets. For example, Wireshark will display CiscoCon_21:b7:ec instead of c8:d7:19:21:b7:ec. The list of manufacturer's codes is kept in the manuf file of the Wireshark installation directory.
The Resolve network-layer names option works in conjunction with Use external network name resolver to determine if or how captured IP addresses are resolved into their hostnames, as follows:
- The Resolve network-layer names option specifies that Wireshark should attempt to resolve IP addresses into hostnames. If the Use external network name resolver option is enabled, Wireshark will perform reverse DNS lookups for each unique IP address. This causes Wireshark to generate traffic of its own.
- If the Use external network name resolver option is disabled, Wireshark will attempt to resolve the IP addresses using a
hoststext file provided by a user (which uses typical IP address<tab>hostname syntax) located in the Wireshark installation directory when using a default profile or in the appropriate profile directory when using a custom profile.
During a capture, it is better to leave the Resolve network-layer names option disabled so that Wireshark isn't creating additional network traffic while trying to resolve IP addresses during a capture. This feature can always be temporarily enabled (by navigating to View | Name Resolution | Enable for network layer from the menu) after the capture is finished.
If the Resolve transport-layer name option is enabled, it causes Wireshark to display the human-readable, port- and protocol-specific services' names instead of the port numbers in the Info display field in the Packet List pane. For example, TCP port 80 will be displayed as HTTP. The list of port number services is kept in the services file in the Wireshark installation directory.
The screenshot at the beginning of this section illustrates a Capture Option window set to use the LAN interface, a filter to capture traffic only to and from a specific Ethernet MAC address, to save up to five files of 100 MB each in a ring buffer scenario, and to save those files in a provided directory with a specific leading filename and extension. The Display Options and Name Resolution options have been left in their default settings.
Once all the desired Capture Options have been selected, clicking on the Start button will start the capture.
Having covered all the most useful Capture Options features, now is probably the right time to tell you that for many of your captures, especially from a relatively low traffic volume location such as from a user workstation, you don't want or need to set any capture options (except the appropriate interface to capture from) and can simply jump into starting a capture using all the defaults by clicking on the third (green shark-fin shaped) icon on the icon bar or selecting Start from the Capture menu. Not using a capture filter allows you to capture all the relevant packets—without missing anything—and filter any unwanted traffic out using display filters after the capture is done.
Capturing filenames and locations
Clicking on the Browse button on the File option allows you to navigate to a chosen directory in which you can store the capture files and enter a filename for the capture files.
When the
File option is used, Wireshark will append a file number and date-time stamp to the filename you specify and will not provide a file extension. You should specify a .pcapng extension in the filename. This is better illustrated with an example.
The user provided directory and filename is C:\Wireshark\long_capture.pcapng, and Wireshark will create and save packets to files in the format C:\Wireshark\long_capture_00001_20140724132952.pcapng.
If Wireshark is configured to capture to more than one file (this will be discussed later), the file numbers and date-time stamps will be incremented accordingly as the capture progresses, for example, long_capture_00002_20140724133343.pcapng and long_capture_00003_20140724133612.pcapng.
Wireshark can be configured to save packets to multiple files to allow long-term captures, and offers a number of options to control how this is accomplished.
Selecting the Use multiple files option causes the appropriate underlying controls to become active as specific options are enabled. You can choose to start a new (next) file when each file reaches a given size and/or after a configurable period.
The Ring buffer option works in conjunction with the Next File every option to cause Wireshark to fill the specified number of files, and as the capture continues to progress, it deletes the oldest files.
This feature is useful to keep a capture running while waiting for some intermittent problem or an event to occur, after which the capture is manually stopped. The ring buffer files provide historical capture data for a period just prior to stopping the capture, without filling a hard drive with an excessive number of large capture files.
Wireshark has options to automatically stop a capture after a specified number of packets, file size, or time period. If the Use multiple files option is enabled, an option to stop the capture after a specified number of files can be employed. Otherwise, the capture can be stopped after a specified number of packets, file size, or time period has elapsed.
The Update list of packets in real time option specifies that Wireshark is to periodically read the capture file as it is being written during the capture and update the Packet List contents accordingly. Otherwise, the Wireshark user interface will be grayed out during the capture.
The Automatically scroll during live capture option specifies that Wireshark updates and displays the latest captured packets in the Packet List pane such that the packets seem to scroll up as the list is updated. The Update list of packets in real time option must be enabled for this option to function.
Both of these options have a processing time cost that could result in lost packets and/or a sluggish display and should be disabled if capturing on a very busy link. However, the ability to view and confirm that the expected packet flows are occurring during the capture will be lost.
The Hide capture info dialog option (which is enabled by default) controls whether a simple window is displayed during the capture that displays the packet counts and percentages by protocol. Unless specifically needed, it is best to leave this window hidden.
If the
Resolve MAC addresses option is enabled, it causes Wireshark to display MAC addresses with an assigned manufacturer code in place of the first three octets. For example, Wireshark will display CiscoCon_21:b7:ec instead of c8:d7:19:21:b7:ec. The list of manufacturer's codes is kept in the manuf file of the Wireshark installation directory.
The Resolve network-layer names option works in conjunction with Use external network name resolver to determine if or how captured IP addresses are resolved into their hostnames, as follows:
- The Resolve network-layer names option specifies that Wireshark should attempt to resolve IP addresses into hostnames. If the Use external network name resolver option is enabled, Wireshark will perform reverse DNS lookups for each unique IP address. This causes Wireshark to generate traffic of its own.
- If the Use external network name resolver option is disabled, Wireshark will attempt to resolve the IP addresses using a
hoststext file provided by a user (which uses typical IP address<tab>hostname syntax) located in the Wireshark installation directory when using a default profile or in the appropriate profile directory when using a custom profile.
During a capture, it is better to leave the Resolve network-layer names option disabled so that Wireshark isn't creating additional network traffic while trying to resolve IP addresses during a capture. This feature can always be temporarily enabled (by navigating to View | Name Resolution | Enable for network layer from the menu) after the capture is finished.
If the Resolve transport-layer name option is enabled, it causes Wireshark to display the human-readable, port- and protocol-specific services' names instead of the port numbers in the Info display field in the Packet List pane. For example, TCP port 80 will be displayed as HTTP. The list of port number services is kept in the services file in the Wireshark installation directory.
The screenshot at the beginning of this section illustrates a Capture Option window set to use the LAN interface, a filter to capture traffic only to and from a specific Ethernet MAC address, to save up to five files of 100 MB each in a ring buffer scenario, and to save those files in a provided directory with a specific leading filename and extension. The Display Options and Name Resolution options have been left in their default settings.
Once all the desired Capture Options have been selected, clicking on the Start button will start the capture.
Having covered all the most useful Capture Options features, now is probably the right time to tell you that for many of your captures, especially from a relatively low traffic volume location such as from a user workstation, you don't want or need to set any capture options (except the appropriate interface to capture from) and can simply jump into starting a capture using all the defaults by clicking on the third (green shark-fin shaped) icon on the icon bar or selecting Start from the Capture menu. Not using a capture filter allows you to capture all the relevant packets—without missing anything—and filter any unwanted traffic out using display filters after the capture is done.
Multiple file options
Wireshark can be configured to save packets to multiple files to allow long-term captures, and offers a number of options to control how this is accomplished.
Selecting the Use multiple files option causes the appropriate underlying controls to become active as specific options are enabled. You can choose to start a new (next) file when each file reaches a given size and/or after a configurable period.
The Ring buffer option works in conjunction with the Next File every option to cause Wireshark to fill the specified number of files, and as the capture continues to progress, it deletes the oldest files.
This feature is useful to keep a capture running while waiting for some intermittent problem or an event to occur, after which the capture is manually stopped. The ring buffer files provide historical capture data for a period just prior to stopping the capture, without filling a hard drive with an excessive number of large capture files.
Wireshark has options to automatically stop a capture after a specified number of packets, file size, or time period. If the Use multiple files option is enabled, an option to stop the capture after a specified number of files can be employed. Otherwise, the capture can be stopped after a specified number of packets, file size, or time period has elapsed.
The Update list of packets in real time option specifies that Wireshark is to periodically read the capture file as it is being written during the capture and update the Packet List contents accordingly. Otherwise, the Wireshark user interface will be grayed out during the capture.
The Automatically scroll during live capture option specifies that Wireshark updates and displays the latest captured packets in the Packet List pane such that the packets seem to scroll up as the list is updated. The Update list of packets in real time option must be enabled for this option to function.
Both of these options have a processing time cost that could result in lost packets and/or a sluggish display and should be disabled if capturing on a very busy link. However, the ability to view and confirm that the expected packet flows are occurring during the capture will be lost.
The Hide capture info dialog option (which is enabled by default) controls whether a simple window is displayed during the capture that displays the packet counts and percentages by protocol. Unless specifically needed, it is best to leave this window hidden.
If the
Resolve MAC addresses option is enabled, it causes Wireshark to display MAC addresses with an assigned manufacturer code in place of the first three octets. For example, Wireshark will display CiscoCon_21:b7:ec instead of c8:d7:19:21:b7:ec. The list of manufacturer's codes is kept in the manuf file of the Wireshark installation directory.
The Resolve network-layer names option works in conjunction with Use external network name resolver to determine if or how captured IP addresses are resolved into their hostnames, as follows:
- The Resolve network-layer names option specifies that Wireshark should attempt to resolve IP addresses into hostnames. If the Use external network name resolver option is enabled, Wireshark will perform reverse DNS lookups for each unique IP address. This causes Wireshark to generate traffic of its own.
- If the Use external network name resolver option is disabled, Wireshark will attempt to resolve the IP addresses using a
hoststext file provided by a user (which uses typical IP address<tab>hostname syntax) located in the Wireshark installation directory when using a default profile or in the appropriate profile directory when using a custom profile.
During a capture, it is better to leave the Resolve network-layer names option disabled so that Wireshark isn't creating additional network traffic while trying to resolve IP addresses during a capture. This feature can always be temporarily enabled (by navigating to View | Name Resolution | Enable for network layer from the menu) after the capture is finished.
If the Resolve transport-layer name option is enabled, it causes Wireshark to display the human-readable, port- and protocol-specific services' names instead of the port numbers in the Info display field in the Packet List pane. For example, TCP port 80 will be displayed as HTTP. The list of port number services is kept in the services file in the Wireshark installation directory.
The screenshot at the beginning of this section illustrates a Capture Option window set to use the LAN interface, a filter to capture traffic only to and from a specific Ethernet MAC address, to save up to five files of 100 MB each in a ring buffer scenario, and to save those files in a provided directory with a specific leading filename and extension. The Display Options and Name Resolution options have been left in their default settings.
Once all the desired Capture Options have been selected, clicking on the Start button will start the capture.
Having covered all the most useful Capture Options features, now is probably the right time to tell you that for many of your captures, especially from a relatively low traffic volume location such as from a user workstation, you don't want or need to set any capture options (except the appropriate interface to capture from) and can simply jump into starting a capture using all the defaults by clicking on the third (green shark-fin shaped) icon on the icon bar or selecting Start from the Capture menu. Not using a capture filter allows you to capture all the relevant packets—without missing anything—and filter any unwanted traffic out using display filters after the capture is done.
Ring buffer
The Ring buffer option works in conjunction with the Next File every option to cause Wireshark to fill the specified number of files, and as the capture continues to progress, it deletes the oldest files.
This feature is useful to keep a capture running while waiting for some intermittent problem or an event to occur, after which the capture is manually stopped. The ring buffer files provide historical capture data for a period just prior to stopping the capture, without filling a hard drive with an excessive number of large capture files.
Wireshark has options to automatically stop a capture after a specified number of packets, file size, or time period. If the Use multiple files option is enabled, an option to stop the capture after a specified number of files can be employed. Otherwise, the capture can be stopped after a specified number of packets, file size, or time period has elapsed.
The Update list of packets in real time option specifies that Wireshark is to periodically read the capture file as it is being written during the capture and update the Packet List contents accordingly. Otherwise, the Wireshark user interface will be grayed out during the capture.
The Automatically scroll during live capture option specifies that Wireshark updates and displays the latest captured packets in the Packet List pane such that the packets seem to scroll up as the list is updated. The Update list of packets in real time option must be enabled for this option to function.
Both of these options have a processing time cost that could result in lost packets and/or a sluggish display and should be disabled if capturing on a very busy link. However, the ability to view and confirm that the expected packet flows are occurring during the capture will be lost.
The Hide capture info dialog option (which is enabled by default) controls whether a simple window is displayed during the capture that displays the packet counts and percentages by protocol. Unless specifically needed, it is best to leave this window hidden.
If the
Resolve MAC addresses option is enabled, it causes Wireshark to display MAC addresses with an assigned manufacturer code in place of the first three octets. For example, Wireshark will display CiscoCon_21:b7:ec instead of c8:d7:19:21:b7:ec. The list of manufacturer's codes is kept in the manuf file of the Wireshark installation directory.
The Resolve network-layer names option works in conjunction with Use external network name resolver to determine if or how captured IP addresses are resolved into their hostnames, as follows:
- The Resolve network-layer names option specifies that Wireshark should attempt to resolve IP addresses into hostnames. If the Use external network name resolver option is enabled, Wireshark will perform reverse DNS lookups for each unique IP address. This causes Wireshark to generate traffic of its own.
- If the Use external network name resolver option is disabled, Wireshark will attempt to resolve the IP addresses using a
hoststext file provided by a user (which uses typical IP address<tab>hostname syntax) located in the Wireshark installation directory when using a default profile or in the appropriate profile directory when using a custom profile.
During a capture, it is better to leave the Resolve network-layer names option disabled so that Wireshark isn't creating additional network traffic while trying to resolve IP addresses during a capture. This feature can always be temporarily enabled (by navigating to View | Name Resolution | Enable for network layer from the menu) after the capture is finished.
If the Resolve transport-layer name option is enabled, it causes Wireshark to display the human-readable, port- and protocol-specific services' names instead of the port numbers in the Info display field in the Packet List pane. For example, TCP port 80 will be displayed as HTTP. The list of port number services is kept in the services file in the Wireshark installation directory.
The screenshot at the beginning of this section illustrates a Capture Option window set to use the LAN interface, a filter to capture traffic only to and from a specific Ethernet MAC address, to save up to five files of 100 MB each in a ring buffer scenario, and to save those files in a provided directory with a specific leading filename and extension. The Display Options and Name Resolution options have been left in their default settings.
Once all the desired Capture Options have been selected, clicking on the Start button will start the capture.
Having covered all the most useful Capture Options features, now is probably the right time to tell you that for many of your captures, especially from a relatively low traffic volume location such as from a user workstation, you don't want or need to set any capture options (except the appropriate interface to capture from) and can simply jump into starting a capture using all the defaults by clicking on the third (green shark-fin shaped) icon on the icon bar or selecting Start from the Capture menu. Not using a capture filter allows you to capture all the relevant packets—without missing anything—and filter any unwanted traffic out using display filters after the capture is done.
Stop capture options
Wireshark has options to automatically stop a capture after a specified number of packets, file size, or time period. If the Use multiple files option is enabled, an option to stop the capture after a specified number of files can be employed. Otherwise, the capture can be stopped after a specified number of packets, file size, or time period has elapsed.
The Update list of packets in real time option specifies that Wireshark is to periodically read the capture file as it is being written during the capture and update the Packet List contents accordingly. Otherwise, the Wireshark user interface will be grayed out during the capture.
The Automatically scroll during live capture option specifies that Wireshark updates and displays the latest captured packets in the Packet List pane such that the packets seem to scroll up as the list is updated. The Update list of packets in real time option must be enabled for this option to function.
Both of these options have a processing time cost that could result in lost packets and/or a sluggish display and should be disabled if capturing on a very busy link. However, the ability to view and confirm that the expected packet flows are occurring during the capture will be lost.
The Hide capture info dialog option (which is enabled by default) controls whether a simple window is displayed during the capture that displays the packet counts and percentages by protocol. Unless specifically needed, it is best to leave this window hidden.
If the
Resolve MAC addresses option is enabled, it causes Wireshark to display MAC addresses with an assigned manufacturer code in place of the first three octets. For example, Wireshark will display CiscoCon_21:b7:ec instead of c8:d7:19:21:b7:ec. The list of manufacturer's codes is kept in the manuf file of the Wireshark installation directory.
The Resolve network-layer names option works in conjunction with Use external network name resolver to determine if or how captured IP addresses are resolved into their hostnames, as follows:
- The Resolve network-layer names option specifies that Wireshark should attempt to resolve IP addresses into hostnames. If the Use external network name resolver option is enabled, Wireshark will perform reverse DNS lookups for each unique IP address. This causes Wireshark to generate traffic of its own.
- If the Use external network name resolver option is disabled, Wireshark will attempt to resolve the IP addresses using a
hoststext file provided by a user (which uses typical IP address<tab>hostname syntax) located in the Wireshark installation directory when using a default profile or in the appropriate profile directory when using a custom profile.
During a capture, it is better to leave the Resolve network-layer names option disabled so that Wireshark isn't creating additional network traffic while trying to resolve IP addresses during a capture. This feature can always be temporarily enabled (by navigating to View | Name Resolution | Enable for network layer from the menu) after the capture is finished.
If the Resolve transport-layer name option is enabled, it causes Wireshark to display the human-readable, port- and protocol-specific services' names instead of the port numbers in the Info display field in the Packet List pane. For example, TCP port 80 will be displayed as HTTP. The list of port number services is kept in the services file in the Wireshark installation directory.
The screenshot at the beginning of this section illustrates a Capture Option window set to use the LAN interface, a filter to capture traffic only to and from a specific Ethernet MAC address, to save up to five files of 100 MB each in a ring buffer scenario, and to save those files in a provided directory with a specific leading filename and extension. The Display Options and Name Resolution options have been left in their default settings.
Once all the desired Capture Options have been selected, clicking on the Start button will start the capture.
Having covered all the most useful Capture Options features, now is probably the right time to tell you that for many of your captures, especially from a relatively low traffic volume location such as from a user workstation, you don't want or need to set any capture options (except the appropriate interface to capture from) and can simply jump into starting a capture using all the defaults by clicking on the third (green shark-fin shaped) icon on the icon bar or selecting Start from the Capture menu. Not using a capture filter allows you to capture all the relevant packets—without missing anything—and filter any unwanted traffic out using display filters after the capture is done.
Display options
The Update list of packets in real time option specifies that Wireshark is to periodically read the capture file as it is being written during the capture and update the Packet List contents accordingly. Otherwise, the Wireshark user interface will be grayed out during the capture.
The Automatically scroll during live capture option specifies that Wireshark updates and displays the latest captured packets in the Packet List pane such that the packets seem to scroll up as the list is updated. The Update list of packets in real time option must be enabled for this option to function.
Both of these options have a processing time cost that could result in lost packets and/or a sluggish display and should be disabled if capturing on a very busy link. However, the ability to view and confirm that the expected packet flows are occurring during the capture will be lost.
The Hide capture info dialog option (which is enabled by default) controls whether a simple window is displayed during the capture that displays the packet counts and percentages by protocol. Unless specifically needed, it is best to leave this window hidden.
If the
Resolve MAC addresses option is enabled, it causes Wireshark to display MAC addresses with an assigned manufacturer code in place of the first three octets. For example, Wireshark will display CiscoCon_21:b7:ec instead of c8:d7:19:21:b7:ec. The list of manufacturer's codes is kept in the manuf file of the Wireshark installation directory.
The Resolve network-layer names option works in conjunction with Use external network name resolver to determine if or how captured IP addresses are resolved into their hostnames, as follows:
- The Resolve network-layer names option specifies that Wireshark should attempt to resolve IP addresses into hostnames. If the Use external network name resolver option is enabled, Wireshark will perform reverse DNS lookups for each unique IP address. This causes Wireshark to generate traffic of its own.
- If the Use external network name resolver option is disabled, Wireshark will attempt to resolve the IP addresses using a
hoststext file provided by a user (which uses typical IP address<tab>hostname syntax) located in the Wireshark installation directory when using a default profile or in the appropriate profile directory when using a custom profile.
During a capture, it is better to leave the Resolve network-layer names option disabled so that Wireshark isn't creating additional network traffic while trying to resolve IP addresses during a capture. This feature can always be temporarily enabled (by navigating to View | Name Resolution | Enable for network layer from the menu) after the capture is finished.
If the Resolve transport-layer name option is enabled, it causes Wireshark to display the human-readable, port- and protocol-specific services' names instead of the port numbers in the Info display field in the Packet List pane. For example, TCP port 80 will be displayed as HTTP. The list of port number services is kept in the services file in the Wireshark installation directory.
The screenshot at the beginning of this section illustrates a Capture Option window set to use the LAN interface, a filter to capture traffic only to and from a specific Ethernet MAC address, to save up to five files of 100 MB each in a ring buffer scenario, and to save those files in a provided directory with a specific leading filename and extension. The Display Options and Name Resolution options have been left in their default settings.
Once all the desired Capture Options have been selected, clicking on the Start button will start the capture.
Having covered all the most useful Capture Options features, now is probably the right time to tell you that for many of your captures, especially from a relatively low traffic volume location such as from a user workstation, you don't want or need to set any capture options (except the appropriate interface to capture from) and can simply jump into starting a capture using all the defaults by clicking on the third (green shark-fin shaped) icon on the icon bar or selecting Start from the Capture menu. Not using a capture filter allows you to capture all the relevant packets—without missing anything—and filter any unwanted traffic out using display filters after the capture is done.
Name resolution options
If the
Resolve MAC addresses option is enabled, it causes Wireshark to display MAC addresses with an assigned manufacturer code in place of the first three octets. For example, Wireshark will display CiscoCon_21:b7:ec instead of c8:d7:19:21:b7:ec. The list of manufacturer's codes is kept in the manuf file of the Wireshark installation directory.
The Resolve network-layer names option works in conjunction with Use external network name resolver to determine if or how captured IP addresses are resolved into their hostnames, as follows:
- The Resolve network-layer names option specifies that Wireshark should attempt to resolve IP addresses into hostnames. If the Use external network name resolver option is enabled, Wireshark will perform reverse DNS lookups for each unique IP address. This causes Wireshark to generate traffic of its own.
- If the Use external network name resolver option is disabled, Wireshark will attempt to resolve the IP addresses using a
hoststext file provided by a user (which uses typical IP address<tab>hostname syntax) located in the Wireshark installation directory when using a default profile or in the appropriate profile directory when using a custom profile.
During a capture, it is better to leave the Resolve network-layer names option disabled so that Wireshark isn't creating additional network traffic while trying to resolve IP addresses during a capture. This feature can always be temporarily enabled (by navigating to View | Name Resolution | Enable for network layer from the menu) after the capture is finished.
If the Resolve transport-layer name option is enabled, it causes Wireshark to display the human-readable, port- and protocol-specific services' names instead of the port numbers in the Info display field in the Packet List pane. For example, TCP port 80 will be displayed as HTTP. The list of port number services is kept in the services file in the Wireshark installation directory.
The screenshot at the beginning of this section illustrates a Capture Option window set to use the LAN interface, a filter to capture traffic only to and from a specific Ethernet MAC address, to save up to five files of 100 MB each in a ring buffer scenario, and to save those files in a provided directory with a specific leading filename and extension. The Display Options and Name Resolution options have been left in their default settings.
Once all the desired Capture Options have been selected, clicking on the Start button will start the capture.
Having covered all the most useful Capture Options features, now is probably the right time to tell you that for many of your captures, especially from a relatively low traffic volume location such as from a user workstation, you don't want or need to set any capture options (except the appropriate interface to capture from) and can simply jump into starting a capture using all the defaults by clicking on the third (green shark-fin shaped) icon on the icon bar or selecting Start from the Capture menu. Not using a capture filter allows you to capture all the relevant packets—without missing anything—and filter any unwanted traffic out using display filters after the capture is done.
After a capture is complete, you should scroll through and inspect the packets in the Packet List pane to ensure that you're seeing the traffic you were expecting—usually traffic to and from a specific host.
You should also ensure there were no dropped packets, which would be displayed in the Packet Information section of the Status Bar at the bottom center of the Wireshark user interface. Dropped packets indicate that Wireshark or the selected NIC could not keep up with the traffic volume and had to discard packets, which could of course affect the quality of your analysis. If dropped packets occur, you may need to use a higher performance workstation to perform the captures or select a lower traffic volume capture location.
After completing and verifying a good capture, you should save the bulk (all captured packets) capture file (assuming a single file capture) to your directory of choice. You will later be filtering and saving a subset of packets to a smaller file, but it is advantageous to be able to load the original capture file again at a later time if during the analysis you discover that you might have inadvertently filtered out more packets than you wanted.
Using the Save As option in the File menu, navigate to the directory of your choice and give the file a name. If no file extension is specified, Wireshark will append a file extension based on the Save as type option selected; the default is the .pcapng format. However, you can save the file in several other popular vendor-specific formats if you intend to share the capture file with someone who is using a different protocol analysis tool.
If multiple files were saved using one of the multiple file and/or ring buffer capture options, navigate to the File | File Set | List Files to select and open one of the files.
After you have completed a packet capture and saved a bulk capture file, you'll be with an almost overwhelming number of packets of various types and addresses in the Packet List pane. It's now time to par this down to just the packets that pertain to the analysis task at hand.
The idea is to progressively eliminate unrelated packets; analyze the pertinent conversations looking for anomalies; and again progressively filter, measure, and analyze packet flow and application behavior until you have discovered and can document the root cause of the issue.
There are two basic ways to isolate and inspect packets and conversations of interest, and you'll likely use both of the following methods in most of your analysis activities:
- Conversations: This window creates a list of conversation pairs by MAC or IP address and/or TCP/UDP ports that can be sorted. It displays filters that will isolate and display only the selected conversation packets can be quickly applied from this window.
- Display Filters: These filters are based on MAC or IP addresses and/or protocol-specific fields that limit the packets displayed in the Packet List pane.
We'll discuss each of these methods in the following sections.
The basics of using the Conversations window were covered during the first capture in Chapter 1, Getting Acquainted with Wireshark. In this section, we'll cover a few other handy features of the Conversations window.
The Conversations window exhibits specific behaviors in the Ethernet tab, depending on the available Name Resolution settings. If Enable for Network Layer in the Name Resolution menu, which can be found in the View menu, is enabled and Name Resolution is also enabled in the Conversations window, then the IP address that is associated with a given device's MAC address is displayed as an IP address instead of a MAC address. Toggling the Name Resolution option in this scenario is useful for easily associating a devices' IP address with its MAC address.
If the Enable for Network Layer option is not enabled, then the Name Resolution option in the Conversations window controls whether the MAC addresses are displayed with manufacturer prefixes or as the basic 6-octet MAC address.
The TCP and UDP tabs of the Conversations window list all of the conversations between devices based on IP addresses and ports. Considering that network communications between a pair of devices, each with their associated IP addresses, could include multiple sequential or simultaneous sessions with differing port numbers, the TCP and UDP tabs (depending on the protocol in use) make it much easier to inspect the number and relative size and start/duration of these individual sessions.
As can be done in any of the other tabs in the Conversations window, a display filter can be quickly prepared or applied using the right-click functionality.
A helpful practice when investigating TCP or UDP sessions is to apply a display filter on just the IP addresses initially and then enabling the Limit to display filter option at the bottom of the Conversations window. Upon returning to the TCP or UDP tab, only the port-level sessions between the filtered host pair are displayed, which makes investigating these sessions much easier than picking them out from the entire list.
The following screenshot shows the multiple TCP sessions that were involved in loading the https://www.wireshark.org/ home page after applying a display filter (from the bulk capture file) and enabling the Limit to display filter option in the Conversations window. It can be seen that the (top) conversation between port 54581 on the user workstation and port 80 (HTTP) carried the vast majority of the traffic; the remaining ports carried much smaller amounts of traffic.
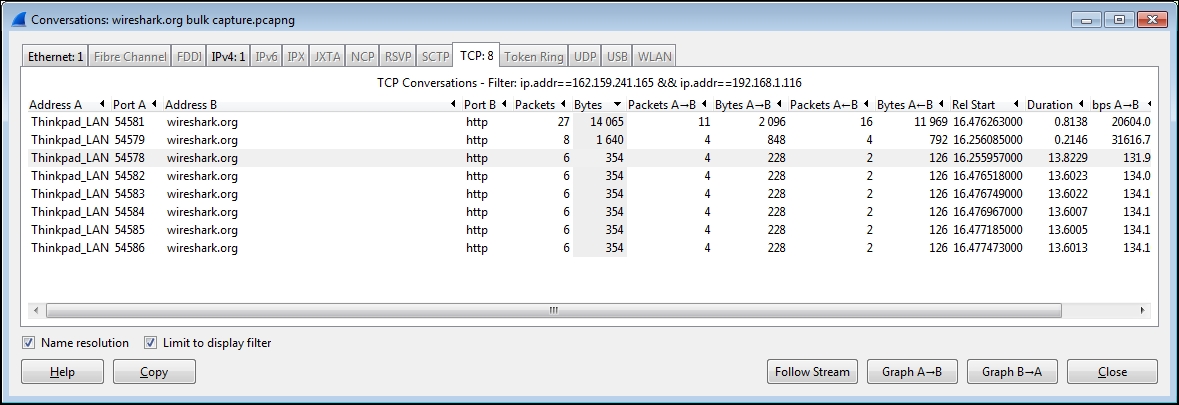
The Ethernet tab
The Conversations window exhibits specific behaviors in the Ethernet tab, depending on the available Name Resolution settings. If Enable for Network Layer in the Name Resolution menu, which can be found in the View menu, is enabled and Name Resolution is also enabled in the Conversations window, then the IP address that is associated with a given device's MAC address is displayed as an IP address instead of a MAC address. Toggling the Name Resolution option in this scenario is useful for easily associating a devices' IP address with its MAC address.
If the Enable for Network Layer option is not enabled, then the Name Resolution option in the Conversations window controls whether the MAC addresses are displayed with manufacturer prefixes or as the basic 6-octet MAC address.
The TCP and UDP tabs of the Conversations window list all of the conversations between devices based on IP addresses and ports. Considering that network communications between a pair of devices, each with their associated IP addresses, could include multiple sequential or simultaneous sessions with differing port numbers, the TCP and UDP tabs (depending on the protocol in use) make it much easier to inspect the number and relative size and start/duration of these individual sessions.
As can be done in any of the other tabs in the Conversations window, a display filter can be quickly prepared or applied using the right-click functionality.
A helpful practice when investigating TCP or UDP sessions is to apply a display filter on just the IP addresses initially and then enabling the Limit to display filter option at the bottom of the Conversations window. Upon returning to the TCP or UDP tab, only the port-level sessions between the filtered host pair are displayed, which makes investigating these sessions much easier than picking them out from the entire list.
The following screenshot shows the multiple TCP sessions that were involved in loading the https://www.wireshark.org/ home page after applying a display filter (from the bulk capture file) and enabling the Limit to display filter option in the Conversations window. It can be seen that the (top) conversation between port 54581 on the user workstation and port 80 (HTTP) carried the vast majority of the traffic; the remaining ports carried much smaller amounts of traffic.
The TCP and UDP tabs
The TCP and UDP tabs of the Conversations window list all of the conversations between devices based on IP addresses and ports. Considering that network communications between a pair of devices, each with their associated IP addresses, could include multiple sequential or simultaneous sessions with differing port numbers, the TCP and UDP tabs (depending on the protocol in use) make it much easier to inspect the number and relative size and start/duration of these individual sessions.
As can be done in any of the other tabs in the Conversations window, a display filter can be quickly prepared or applied using the right-click functionality.
A helpful practice when investigating TCP or UDP sessions is to apply a display filter on just the IP addresses initially and then enabling the Limit to display filter option at the bottom of the Conversations window. Upon returning to the TCP or UDP tab, only the port-level sessions between the filtered host pair are displayed, which makes investigating these sessions much easier than picking them out from the entire list.
The following screenshot shows the multiple TCP sessions that were involved in loading the https://www.wireshark.org/ home page after applying a display filter (from the bulk capture file) and enabling the Limit to display filter option in the Conversations window. It can be seen that the (top) conversation between port 54581 on the user workstation and port 80 (HTTP) carried the vast majority of the traffic; the remaining ports carried much smaller amounts of traffic.
Wireshark provides a very wide range of protocol-specific display filters that can be extremely useful for analysis activities by allowing you to focus on specific packets, based on criteria that you define. You can filter on just the traffic that you want to see or filter undesired traffic out of view. Display filters are one of the most helpful features of Wireshark, so they warrant becoming very familiar with.
Display filters can be created in several ways:
- By applying display filters from the Display Filter window
- By typing in the display filter syntax (using autocomplete)
- By applying display filters from the Conversations (or Endpoints) window
- By applying saved display filters from Filter Expression Buttons
- Using the Expressions button for assistance creating filters
- Using right-click menus on specific packet fields
You can open the Display Filter window by selecting Display Filters from the Analyze menu, by clicking on the Edit/apply display filter icon on the icon bar, or by just clicking the Filters button next to the display filter textbox on the display filter bar.
The Display Filter window looks and functions in a similar fashion to the capture filters window, as shown in the following screenshot. You can create a new custom display filter to be added to this window by entering a filter name and the appropriate syntax and clicking on New or clicking an existing filter. Click on New and modify/rename as per your requirements.

Display filters listed in this window were saved in a dfilters file in the Wireshark installation directory for the default profile and in the appropriate Personal configuration directory when custom profiles are in use.
When you apply a display filter, the Status Bar at the bottom of the Wireshark user interface screen reflects the total number of packets and the packets displayed, as illustrated in the following screenshot:

The default selection of capture filters from the Display Filter window shown previously provides examples of basic capture filter syntax. Additional examples of display filter syntax are outlined in the following table:
|
Description |
Syntax |
Examples |
|---|---|---|
|
Basic protocols |
|
Same as syntax examples |
|
Display filter comparison operators |
|
|
|
Protocol-specific extensions |
protocol-specific |
|
|
Classless InterDomain Routing (CIDR) notation on IPv4 addresses |
|
|
Note
Using the != operator on expressions such as eth.addr, ip.addr, tcp.port, and udp.port and alike may not work as expected as there are usually two addresses and ports in a packet, and the ! operator will not match both instances.
Use !(ip.addr == x.x.x.x) or a similar syntax for these types of filters.
More information and examples of display filters can be found on the Wireshark wiki at http://wiki.wireshark.org/DisplayFilters and protocol-specific display filter syntax is included in the reference information found at http://wiki.wireshark.org/ProtocolReference.
You can type a display filter syntax directly into the Filter textbox in the display filter bar, and then click on Apply to apply the filter or Clear to clear a filter and start over.
A helpful feature of typing the display filter syntax into the textbox is the autocomplete function. Upon typing a protocol and then a period (.), the textbox will display a list of available protocol-related extensions that can be selected and then the appropriate comparison operator and value added before clicking on Apply.
The textbox also has a color-coded background indicating the display filter syntax status. If the syntax is incorrect or incomplete, the background is red and a correct filter results in a green background. A yellow background is a warning that the entered syntax may not work as expected.
The Display Filter window
You can open the Display Filter window by selecting Display Filters from the Analyze menu, by clicking on the Edit/apply display filter icon on the icon bar, or by just clicking the Filters button next to the display filter textbox on the display filter bar.
The Display Filter window looks and functions in a similar fashion to the capture filters window, as shown in the following screenshot. You can create a new custom display filter to be added to this window by entering a filter name and the appropriate syntax and clicking on New or clicking an existing filter. Click on New and modify/rename as per your requirements.
Display filters listed in this window were saved in a dfilters file in the Wireshark installation directory for the default profile and in the appropriate Personal configuration directory when custom profiles are in use.
When you apply a display filter, the Status Bar at the bottom of the Wireshark user interface screen reflects the total number of packets and the packets displayed, as illustrated in the following screenshot:
The default selection of capture filters from the Display Filter window shown previously provides examples of basic capture filter syntax. Additional examples of display filter syntax are outlined in the following table:
|
Description |
Syntax |
Examples |
|---|---|---|
|
Basic protocols |
|
Same as syntax examples |
|
Display filter comparison operators |
|
|
|
Protocol-specific extensions |
protocol-specific |
|
|
Classless InterDomain Routing (CIDR) notation on IPv4 addresses |
|
|
Note
Using the != operator on expressions such as eth.addr, ip.addr, tcp.port, and udp.port and alike may not work as expected as there are usually two addresses and ports in a packet, and the ! operator will not match both instances.
Use !(ip.addr == x.x.x.x) or a similar syntax for these types of filters.
More information and examples of display filters can be found on the Wireshark wiki at http://wiki.wireshark.org/DisplayFilters and protocol-specific display filter syntax is included in the reference information found at http://wiki.wireshark.org/ProtocolReference.
You can type a display filter syntax directly into the Filter textbox in the display filter bar, and then click on Apply to apply the filter or Clear to clear a filter and start over.
A helpful feature of typing the display filter syntax into the textbox is the autocomplete function. Upon typing a protocol and then a period (.), the textbox will display a list of available protocol-related extensions that can be selected and then the appropriate comparison operator and value added before clicking on Apply.
The textbox also has a color-coded background indicating the display filter syntax status. If the syntax is incorrect or incomplete, the background is red and a correct filter results in a green background. A yellow background is a warning that the entered syntax may not work as expected.
The display filter syntax
The default selection of capture filters from the Display Filter window shown previously provides examples of basic capture filter syntax. Additional examples of display filter syntax are outlined in the following table:
|
Description |
Syntax |
Examples |
|---|---|---|
|
Basic protocols |
|
Same as syntax examples |
|
Display filter comparison operators |
|
|
|
Protocol-specific extensions |
protocol-specific |
|
|
Classless InterDomain Routing (CIDR) notation on IPv4 addresses |
|
|
Note
Using the != operator on expressions such as eth.addr, ip.addr, tcp.port, and udp.port and alike may not work as expected as there are usually two addresses and ports in a packet, and the ! operator will not match both instances.
Use !(ip.addr == x.x.x.x) or a similar syntax for these types of filters.
More information and examples of display filters can be found on the Wireshark wiki at http://wiki.wireshark.org/DisplayFilters and protocol-specific display filter syntax is included in the reference information found at http://wiki.wireshark.org/ProtocolReference.
You can type a display filter syntax directly into the Filter textbox in the display filter bar, and then click on Apply to apply the filter or Clear to clear a filter and start over.
A helpful feature of typing the display filter syntax into the textbox is the autocomplete function. Upon typing a protocol and then a period (.), the textbox will display a list of available protocol-related extensions that can be selected and then the appropriate comparison operator and value added before clicking on Apply.
The textbox also has a color-coded background indicating the display filter syntax status. If the syntax is incorrect or incomplete, the background is red and a correct filter results in a green background. A yellow background is a warning that the entered syntax may not work as expected.
Typing in a display filter
You can type a display filter syntax directly into the Filter textbox in the display filter bar, and then click on Apply to apply the filter or Clear to clear a filter and start over.
A helpful feature of typing the display filter syntax into the textbox is the autocomplete function. Upon typing a protocol and then a period (.), the textbox will display a list of available protocol-related extensions that can be selected and then the appropriate comparison operator and value added before clicking on Apply.
The textbox also has a color-coded background indicating the display filter syntax status. If the syntax is incorrect or incomplete, the background is red and a correct filter results in a green background. A yellow background is a warning that the entered syntax may not work as expected.
Display filters from a Conversations or Endpoints window
Creating a display filter to be applied from a Conversations window has already been covered. The same functionality is available from an Endpoints window, which can be opened by selecting Endpoint List from the Statistics menu and one of the listed protocols.
Filter Expression Buttons are buttons you can create that are based on display filters; these can be used to quickly apply previously-saved display filters to your capture data to identify network and application problems.
For example, to create a Filter Expression Button option that displays just TCP SYN, SYN/ACK, FIN, or RST packets to analyze the TCP session setup parameters, network round-trip delay times, and session terminations:
- Type the following display filter string into the Filter textbox on the Display Filter Bar:
(tcp.flags&02 && tcp.seq==0) || (tcp.flags&12 && tcp.seq==0) || (tcp.flags.ack && tcp.seq==1 && !tcp.nxtseq > 0 && !tcp.ack >1) || tcp.flags.fin == 1 || tcp.flags.reset ==1
- Clicking on Apply will apply this filter to a capture that you have loaded so that you can confirm that it is working properly.
- Then, click on Save and give the button a name, such as
TCP Handshake(as illustrated in the following screenshot). Then, click on OK:
The filter expression buttons you create will appear on the right-hand side of the initial controls in the display filter bar, as illustrated in the following screenshot:

The filter expression button definitions are stored in the preferences file for the profile you are using. You can edit the button display order, edit the name or filter syntax, or delete the buttons in Wireshark's Preferences window.
To the right-hand side of the textbox on the display filter toolbar is the Expression button. Clicking on this button opens a Filter Expression window that allows you to select a protocol and the extension to that protocol, one of the appropriate relation (comparison) operators, and assign a comparison value. Click on OK to populate the display filter textbox with the resultant display filter syntax and then click on Apply to apply the filter.
If you right-click on a specific field in the Packet List or Packet Details panes, you can select the Apply as Filter or Prepare a Filter option and the required submenu option to create display filter syntax, as illustrated in the following screenshot. This is a very quick way of creating display filter syntax:

If you are selecting a field and using the right-click functionality to create display filter syntax, it is usually better to use the Prepare a Filter option, which will allow you to edit the syntax before clicking on Apply to apply the filter.
Using the Expressions window button
To the right-hand side of the textbox on the display filter toolbar is the Expression button. Clicking on this button opens a Filter Expression window that allows you to select a protocol and the extension to that protocol, one of the appropriate relation (comparison) operators, and assign a comparison value. Click on OK to populate the display filter textbox with the resultant display filter syntax and then click on Apply to apply the filter.
If you right-click on a specific field in the Packet List or Packet Details panes, you can select the Apply as Filter or Prepare a Filter option and the required submenu option to create display filter syntax, as illustrated in the following screenshot. This is a very quick way of creating display filter syntax:
If you are selecting a field and using the right-click functionality to create display filter syntax, it is usually better to use the Prepare a Filter option, which will allow you to edit the syntax before clicking on Apply to apply the filter.
Right-click menus on specific packet fields
If you right-click on a specific field in the Packet List or Packet Details panes, you can select the Apply as Filter or Prepare a Filter option and the required submenu option to create display filter syntax, as illustrated in the following screenshot. This is a very quick way of creating display filter syntax:
If you are selecting a field and using the right-click functionality to create display filter syntax, it is usually better to use the Prepare a Filter option, which will allow you to edit the syntax before clicking on Apply to apply the filter.
Selecting a packet in a conversation, right-clicking, and selecting a Follow TCP Stream, Follow UDP Stream, or Follow SSL Stream option (as appropriate) from the menu provides a display window that contains a textual depiction of the payload data from all of the packets in a conversation. This is an excellent way to inspect the contents of a stream without having to select and inspect multiple packets. Viewing the exchanges between the client and server can be very helpful for troubleshooting purposes.
When a Follow Stream option is selected for a given packet, a display filter is automatically created and applied to support creation of this window. The following screenshot illustrates a Follow TCP Stream window. Also, note the display filter syntax (tcp.stream eq 15) that was created and applied when this stream was selected:
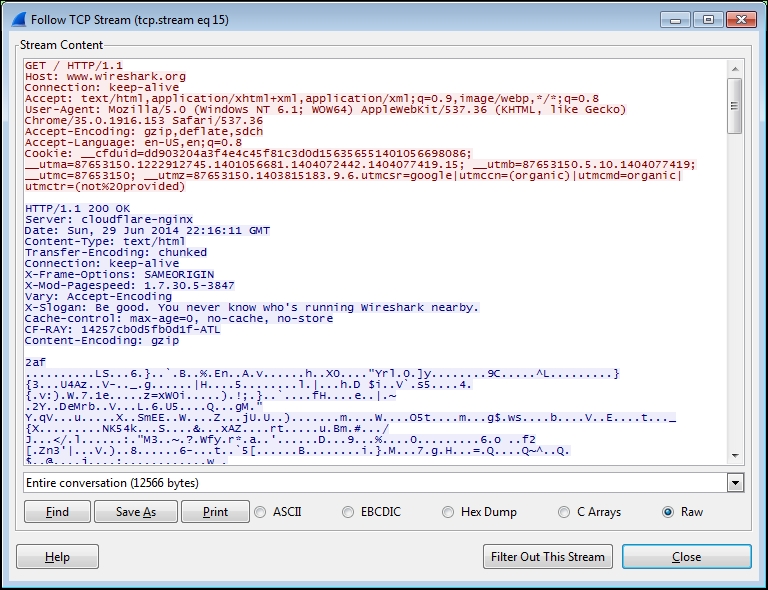
You can toggle Mark/Unmark Packet or Ignore/Unignore Packet from the Wireshark Edit menu, or by right-clicking on a packet in the Packet List pane and selecting Mark Packet (toggle) or Ignore Packet (toggle).
The menu displayed by right-clicking on a packet in the Packet List pane is shown in the following screenshot:

Wireshark allows you to mark one or more packets in the Packet List pane to make it easier to find those packets later by giving the packet entry a black background with white font. This marking can be toggled on and off on a per-packet basis. Marking a packet has no other effect on the display or packet context.
You can also ignore one or more packets. However, when you invoke the ignore function on a packet that packet entry disappears from the Packet List, Packet Details, and Packet Bytes panes and it effectively ceases (temporarily) to be part of the capture file. Note that ignoring packets can result in Wireshark reporting re-transmissions or other error conditions caused by the missing packet.
The ignored packets aren't actually deleted from the capture file as you can use the Reload option in the View menu or click the Reload icon on the icon bar to recover the ignored packets.
During or after completing an analysis, you will want to save a set of filtered packets into a new capture file. Saving a filtered subset of the bulk capture data and opening the new, smaller file in Wireshark is helpful to reduce the distracting background noise packets displayed when clearing display filters, working with Conversations windows, and so on during your analysis. Finally, upon completing your analysis, you will want a filtered capture file that represents the analysis evidence and conclusion and can be quickly loaded for review at a later time.
Use the Export Specified Packets option in the File menu to save a new capture file consisting of just your filtered packets. Navigate to the desired directory; enter a filename (Wireshark will provide the appropriate filename extension); make the appropriate selections to save all the Displayed packets, Marked packets, and/or to Remove Ignored packets; and then click on Save. Remember to save the complete capture using the Save As option in the File menu as well, because you may need this file again.
The following screenshot illustrates a typical Export Specified Packets window and its selections:

The important points covered in this chapter included picking an optimal capture point, selecting between TAPs and mirrored/SPAN ports, Wireshark's capture filters and options, verifying a good capture, using Wireshark's Conversation windows and display filters to isolate packets of interest, creating Filter Expression Buttons, marking and ignoring packets, and saving the filtered traffic for later or more detailed analysis.
In the next chapter, we'll cover the rest of Wireshark's basic packet analysis features.