

Dashboards in TFS provide a customizable canvas that allows your team to visualize and monitor progress. Dashboards replace the previous Team Overview page, providing easy-to-read, real-time information. At a glance, you can make informed decisions without having to drill down into other parts of your team project. Visibility of work is a core concept of Agile software development, and dashboards make it really easy to create an information radiator for your team and stakeholders.
Every team project is created with a default dashboard. You can access the PartsUnlimited dashboard by navigating to the dashboard hub. Anyone with access to the team project, including stakeholders, can view dashboards. Dashboards use widgets to surface information. There is no limit on how many dashboards you can create. Let's start off by creating a new dashboard for sprint 1. At this point, don't add any widgets to the dashboard. Click the Settings icon in the top right-hand corner of the page and select the option to auto-refresh the sprint 1 dashboard. Auto-refresh keeps the dashboard up-to-date; it's fantastic if you intend to project the dashboard view on a television screen.
The TFS marketplace features the Product Vision widget (https://marketplace.visualstudio.com/items?itemName=agile-extensions.product-vision), a free extension that was developed by Agile extensions and allow you to make product vision visible to the whole team by surfacing it to a dashboard via a widget. The sprint countdown widget (https://marketplace.visualstudio.com/items?itemName=ms-devlabs.CountdownWidget) is also a free extension and was developed by the Microsoft DevLabs team, and allows you to count down to a configurable moment in time, or down to the end of the current sprint.
Let's perform the following steps:
- Open the
Sprint 1dashboard and click the+icon from the lower right-hand side of the page. This launches theAdd widgetpane. - Search and add the sprint countdown, product vision, markdown widget, sprint capacity, charts widget, query results widget, sprint burn down, and the sprint overview widget, as shown in the following screenshot:
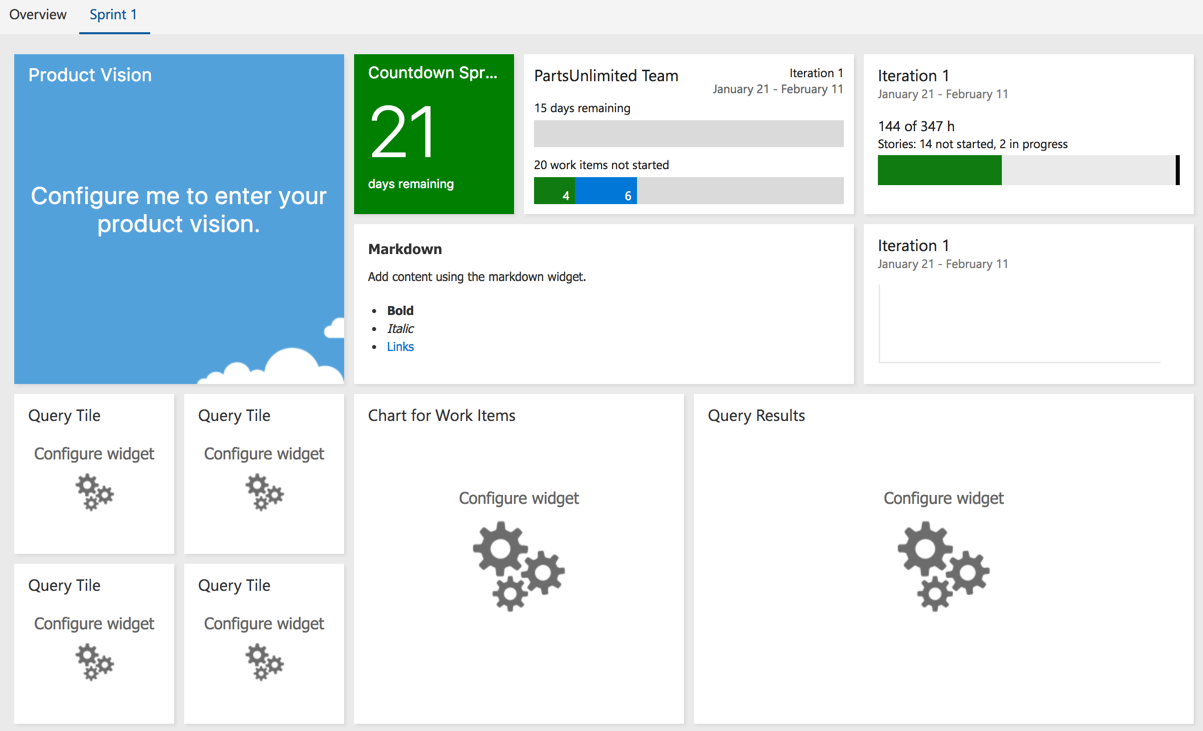
- With the relevant widgets on the board, click on individual widgets to start configuring them. The
Configure workflow on all the tasksoption is very intuitive, for example, the query tile allows you to configure a work item query to it and specify a styling rule to change the color of the widget based on the number of work items returned by the query. The chart for the work items query allows you to render the results of the work item query as a chart of your choice, with further customization options for colors. The query result returns the work item list for the work item query that was configured by you, giving you the option of which columns to return.
Widgets use the TFS REST API to retrieve information. The dashboard canvas allows you to move widgets aroundand scale them to different sizes. Widgets support interactivity; for example, clicking on the Query Tile would take you straight into the Work Item Query window. Once the widgets on the dashboard have been configured, you'll see output similar to the following:

The TFS marketplace (https://marketplace.visualstudio.com/search?term=widget&target=VSTS&category=All%20categories&hosting=onpremises&sortBy=Relevance) features a lot of useful widgets, with an evergrowing collection of widgets – some of which will be of interest to you.