Book Image

R Statistics Cookbook

By : Francisco Juretig
2 (2)
Book Image

R Statistics Cookbook

2 (2)
By: Francisco Juretig

Overview of this book

R is a popular programming language for developing statistical software. This book will be a useful guide to solving common and not-so-common challenges in statistics. With this book, you'll be equipped to confidently perform essential statistical procedures across your organization with the help of cutting-edge statistical tools. You'll start by implementing data modeling, data analysis, and machine learning to solve real-world problems. You'll then understand how to work with nonparametric methods, mixed effects models, and hidden Markov models. This book contains recipes that will guide you in performing univariate and multivariate hypothesis tests, several regression techniques, and using robust techniques to minimize the impact of outliers in data.You'll also learn how to use the caret package for performing machine learning in R. Furthermore, this book will help you understand how to interpret charts and plots to get insights for better decision making. By the end of this book, you will be able to apply your skills to statistical computations using R 3.5. You will also become well-versed with a wide array of statistical techniques in R that are extensively used in the data science industry.
Table of Contents (12 chapters)

Leverage, residuals, and influence

For each observation used in a model, there are three relevant metrics that help us to understand the impact of it on the estimated coefficients. The first metric is the leverage: the potential of an observation to change the estimated coefficient. The second relevant metric is the residual, which is the difference between the prediction and the observed value. Finally, the third is the influence, which can be thought of as the product between the leverage and the residual(ness). Another way of looking at this would be to think of the leverage as the horizontal distance between an observation and the rest of the regression line and the residual as the vertical distance between the observation and the regression line. Essentially, we can have four cases, as depicted in the following graphs:

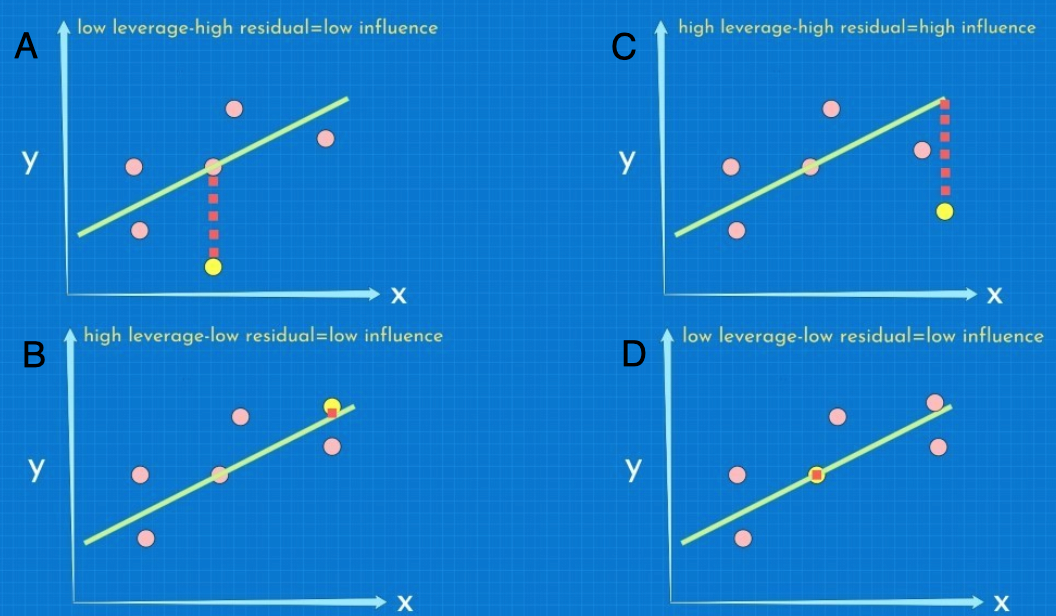
In A, we have an observation with a high residual...