
Scenario: You are asked in an interview to implement a k-means clustering algorithm from scratch to prove that you understand how it works. We will be using the Iris dataset provided by the UCI ML repository. The Iris dataset is a classic in the data science world and has features that are used to predict Iris species. The download location can be found later in this activity.
For this activity, you are able to use Matplotlib, NumPy, scikit-learn metrics, and pandas.
By loading and reshaping data easily, you can focus more on learning k-means instead of writing dataloader functionality.
Iris data columns are provided as follows for reference:
['SepalLengthCm', 'SepalWidthCm', 'PetalLengthCm', 'PetalWidthCm', 'species']
Aim: To truly understand how something works, you need to build it from scratch. Take what you have learned in the previous sections and implement k-means from scratch in Python.
Please open your favorite editing platform and try the following:
Using NumPy or the math package and the Euclidean distance formula and write a function that calculates the distance between two coordinates.
Write a function that calculates the distance from centroids to each of the points in your dataset and returns the cluster membership.
Write a k-means function that takes in a dataset and the number of clusters (K) and returns the final cluster centroids, as well as the data points that make up that cluster's membership. After implementing k-means from scratch, apply your custom algorithm to the Iris dataset, located here: https://github.com/TrainingByPackt/Unsupervised-Learning-with-Python/tree/master/Lesson01/Activity01.
Note
This dataset was downloaded from https://archive.ics.uci.edu/ml/machine-learning-databases/iris/iris.data. It can be accessed at https://github.com/TrainingByPackt/Unsupervised-Learning-with-Python/tree/master/Lesson01/Activity01.
UCI Machine Learning Repository [http://archive.ics.uci.edu/ml]. Irvine, CA: University of California, School of Information and Computer Science.
Remove the classes supplied in this dataset and see if your k-means algorithm can group the different Iris species into their proper groups just based on plant characteristics!
Calculate the Silhouette Score using the scikit-learn implementation.
Outcome: By completing this exercise, you will gain hands-on experience of tuning a k-means clustering algorithm for a real-world dataset. The Iris dataset is seen as a classic "hello world" type problem in the data science space and is helpful for testing foundational techniques on. Your final clustering algorithm should do a decent job of finding the three clusters of Iris species types that exist in the data, as follows:
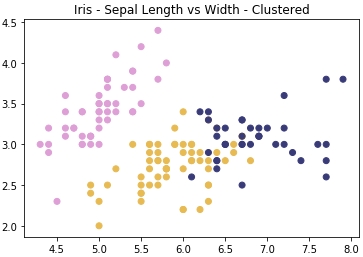
Figure 1.21: Expected plot of three clusters of Iris species