

Traditionally, QlikView has been a totally in-memory tool. If you want to analyze any information, you need to get all of the data into memory. This has caused problems for many enterprise organizations because of the sheer size of data that they wanted to analyze. You can get quite a lot of data into QlikView—billions of rows are not uncommon on very large servers, but there is a limit. Especially in the last few years where businesses have started to take note of the buzz around Big Data, many believed that QlikView could not play in this area.
Direct Discovery was introduced with QlikView Version 11.20. In Version 11.20 SR5, it was updated with a new, more sensible syntax. This syntax is also available in Qlik Sense. What Direct Discovery does is allow a QlikView model to connect directly to a data source without having to load all of the data into memory. Instead, we load only dimension values and, when necessary, QlikView generates a query to retrieve the required results from the database.
Of course, this does have the potential to reduce some of the things that make QlikView very popular—the sub-second response to selections, for example. Every time that a user makes a selection, QlikView generates a query to pass through to the database connection. The faster the data connection, the faster the response, so a performative data warehouse is a boon for Direct Discovery. But speed is not always everything—with Direct Discovery, we can connect to any valid connection that we might normally connect to with the QlikView script; this includes ODBC connectors to Big Data sources such as Cloudera or Google.
Note
Here we will get an introduction to using Direct Discovery, but we should read the more detailed technical details published by the Qlik Community, for example, the SR5 technical addendum at http://community.qlik.com/docs/DOC-3710.
There are a few restrictions of Direct Discovery that will probably be addressed with subsequent service releases:
Only one direct table is supported: This restriction has been lifted in QlikView 11.20 SR7 and Qlik Sense 1.0. Prior to those versions, you could only have one direct query in your data model. All other tables in the data model must be in-memory.
Set Analysis and complex expressions not supported: Because the query is generated on the fly, it just can't work with the likes of a
Set Analysisquery. Essentially, only calculations that can be performed on the source database—Sum,Count,Avg,Min,Max—will work via Direct Discovery.Only SQL compliant data sources: Direct Discovery will only work against connections that support SQL, such as ODBC, OLEDB, and custom connectors such as SAP and JDBC. Note that there are some system variables that may need to be set for some connectors, such as SAP or Google Big Query.
Direct fields are not supported in global search: Global search can only operate against in-memory data.
Security restrictions: Prior to QlikView 11.20 SR7 and Qlik Sense 1.0, Section Access reduction can work on the in-memory data, but will not necessarily work against the
Directtable. Similarly,LoopandReduceinPublisherwon't work correctly.Synthetic keys not supported: You can only have native key associations.
AutoNumberwill obviously not be supported on the direct table.Calculated dimensions not supported: You can only create calculated dimensions against in-memory data.
Naming the Direct table: You can't create a table alias. The table will always be called
DirectTable.
It is also worth knowing that QlikView will use its cache to store the results of queries. So if you hit the Back button, the query won't be rerun against the source database. However, this may have consequences when the underlying data is updated more rapidly. There is a variable—DirectCacheSeconds—that can be set to limit the time that data is cached. This defaults to 3600 seconds.
The most important statement is the opening one:
DIRECT QUERY
This tells QlikView to expect some further query components. It is similar to the SQL statement that tells QlikView to execute the subsequent query and get the results into the memory. The DIRECT QUERY is followed by:
DIMENSION Dim_1, Dim_2, ..., Dim_n
We must have at least one dimension field. These fields will have their values loaded into a symbol table and state space. This means that they can be used as normal in listboxes, tables, charts, and so on. Typically, the DIMENSION list will be followed by:
MEASURE Val_1, Val_2, ..., Val_n
These fields are not loaded into the data model. They can be used, however, in expressions. You can also have additional fields that are not going to be used in expressions or dimensions:
DETAIL Note_1, Note_2, ..., Note_n
These DETAIL fields can only be used in table boxes to give additional context to other values. This is useful for text note fields.
Finally, there may be fields that you want to include in the generated SQL query but are not interested in using in the QlikView model:
DETACH other_1, other_2, ..., other_n
Finally, you can also add a limitation to your query using a standard WHERE clause:
WHERE x=y
The statement will, of course, be terminated by a semicolon.
We can also pass valid SQL syntax statements to calculate dimensions:
NATIVE('Valid SQL ''syntax'' in quotes') As Field_xIf your SQL syntax also has single quotes, then you will need to double-up on the single quotes to have it interpreted correctly.
The following is an example of a Direct Query to a SQL server database:
DIRECT QUERY
dimension
   OrderID,
   FLOOR(OrderDate) As DateID,
    CustomerID,
    EmployeeID,
    ProductID
measure
    Quantity,
    SalesPrice,
    LineValue,
    LineCost
detail
    Freight,
    LineNo
FROM QWT.dbo."Order_Fact";
This results in a table view like the following:
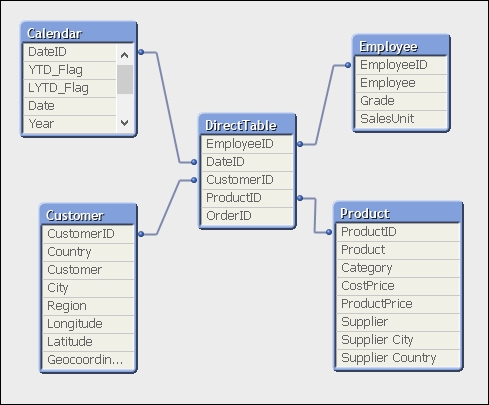
You will note that the list of fields in the table view only contains the dimension values. The measure values are not shown.
You can now go ahead and build charts mostly as normal (without, unfortunately, Set Analysis!), but note that you will see a lot more of the hourglass:
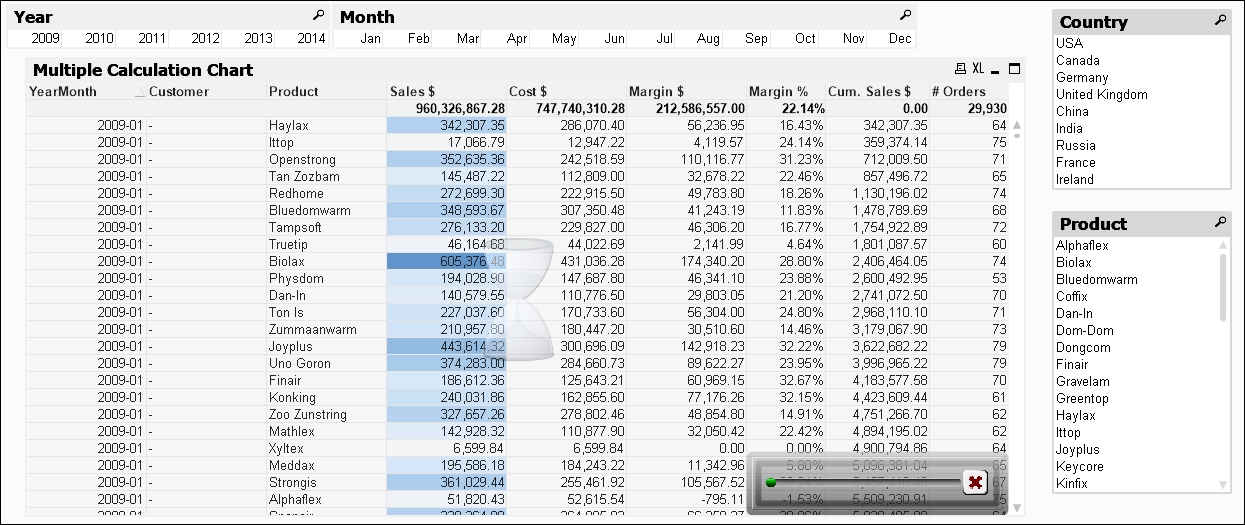
The X in the bottom corner of the chart can be used to cancel the execution of the direct query.