

Data Integration
So far, we've made sure to remove the impurities in data and make it clean. Now, the next step is to combine data from different sources to get a unified structure with more meaningful and valuable information. This is mostly used if the data is segregated into different sources. To make it simple, let's assume we have data in CSV format in different places, all talking about the same scenario. Say we have some data about an employee in a database. We can't expect all the data about the employee to reside in the same table. It's possible that the employee's personal data will be located in one table, the employee's project history will be in a second table, the employee's time-in and time-out details will be in another table, and so on. So, if we want to do some analysis about the employee, we need to get all the employee data in one common place. This process of bringing data together in one place is called data integration. To do data integration, we can merge multiple pandas DataFrames using the merge function.
Let's solve an exercise based on data integration to get a clear understanding of it.
Exercise 5: Integrating Data
In this exercise, we'll merge the details of students from two datasets, namely student.csv and marks.csv. The student dataset contains columns such as Age, Gender, Grade, and Employed. The marks.csv dataset contains columns such as Mark and City. The Student_id column is common between the two datasets. Follow these steps to complete this exercise:
Note
The student.csv dataset can be found at this location: https://github.com/TrainingByPackt/Data-Science-with-Python/blob/master/Chapter01/Data/student.csv.
The marks.csv dataset can be found at this location: https://github.com/TrainingByPackt/Data-Science-with-Python/blob/master/Chapter01/Data/mark.csv.
- Open a Jupyter notebook and add a new cell. Write the following code to import pandas and load the student.csv and marks.csv datasets into the df1 and df2 pandas DataFrames:
import pandas as pd
dataset1 = "https://github.com/TrainingByPackt/Data-Science-with-Python/blob/master/Chapter01/Data/student.csv"
dataset2 = "https://github.com/TrainingByPackt/Data-Science-with-Python/blob/master/Chapter01/Data/mark.csv"
df1 = pd.read_csv(dataset1, header = 0)
df2 = pd.read_csv(dataset2, header = 0)
- To print the first five rows of the first DataFrame, add the following code:
df1.head()
The preceding code generates the following output:

Figure 1.25: The first five rows of the first DataFrame
- To print the first five rows of the second DataFrame, add the following code:
df2.head()
The preceding code generates the following output:
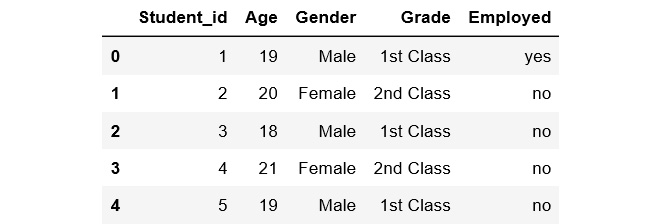
Figure 1.26: The first five rows of the second DataFrame
- Student_id is common to both datasets. Perform data integration on both the DataFrames with respect to the Student_id column using the pd.merge() function, and then print the first 10 values of the new DataFrame:
df = pd.merge(df1, df2, on = 'Student_id')
df.head(10)
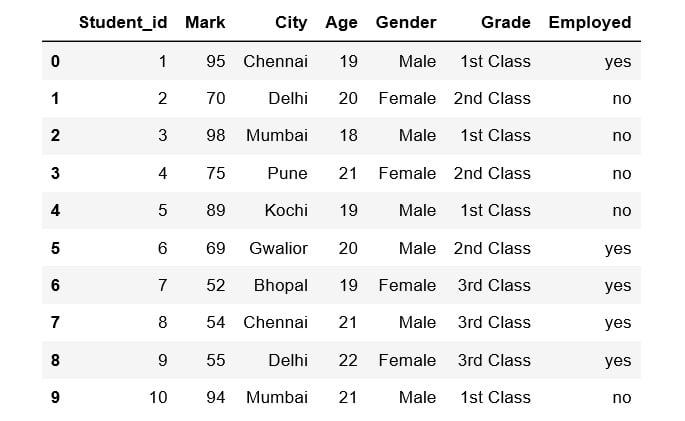
Figure 1.27: First 10 rows of the merged DataFrame
Here, the data of the df1 DataFrame is merged with the data of the df2 DataFrame. The merged data is stored inside a new DataFrame called df.
We have now learned how to perform data integration. In the next section, we'll explore another pre-processing task, data transformation.