Book Image

Applied Supervised Learning with R

By : Karthik Ramasubramanian, Jojo Moolayil
Book Image

Applied Supervised Learning with R

By: Karthik Ramasubramanian, Jojo Moolayil

Overview of this book

R provides excellent visualization features that are essential for exploring data before using it in automated learning. Applied Supervised Learning with R helps you cover the complete process of employing R to develop applications using supervised machine learning algorithms for your business needs. The book starts by helping you develop your analytical thinking to create a problem statement using business inputs and domain research. You will then learn different evaluation metrics that compare various algorithms, and later progress to using these metrics to select the best algorithm for your problem. After finalizing the algorithm you want to use, you will study the hyperparameter optimization technique to fine-tune your set of optimal parameters. The book demonstrates how you can add different regularization terms to avoid overfitting your model. By the end of this book, you will have gained the advanced skills you need for modeling a supervised machine learning algorithm that precisely fulfills your business needs.
Table of Contents (12 chapters)
Applied Supervised Learning with R
Preface

Evaluating Classification Models


Classification models require a bunch of different metrics to be thoroughly evaluated, unlike regression models. Here, we don't have something as intuitive as R Squared. Moreover, the performance requirements completely change based on a specific use case. Let's take a brief look at the various metrics that we already studied in Chapter 3, Introduction to Supervised Learning, for classification.

Confusion Matrix and Its Derived Metrics

The first basis for studying model performance for classification algorithms starts with a confusion matrix. A confusion matrix is a simple representation of the distribution of predictions of each class across the actuals of each class:

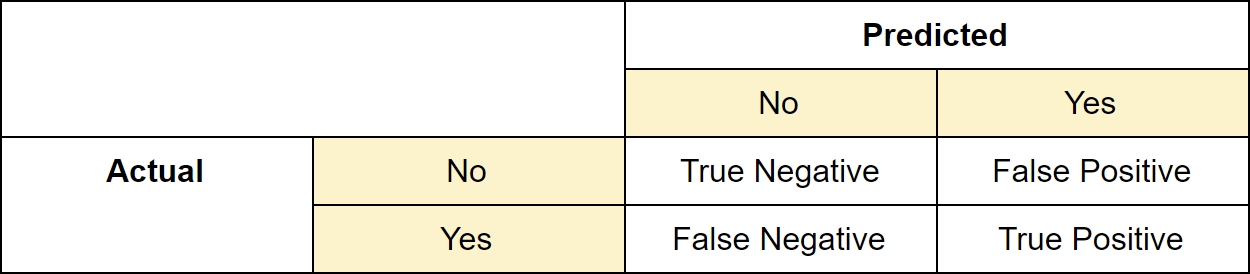
Figure 5.3: Confusion matrix

The previous table is a simple representation of a confusion matrix. Here, we assume that the Yes class is labelled Positive. When the actual value of a given sample is Yes and it is correctly predicted as Positive, we define it as True Positive, whereas, if the actual...