

Before we start exploring locators, we need to analyze the page and elements to understand how these are structured in the application, what properties or attributes are defined for the elements, how JavaScript or AJAX calls are made from the application, and so on.
Browsers render visual elements of the application for end users by hiding the HTML code and other resources. When we want to automate interaction with the application using Selenium WebDriver, we need to look carefully at the background code written to render pages and elements in browsers. We need to identify information such as attribute values and elements structure for locating elements and perform user actions using Selenium WebDriver API.
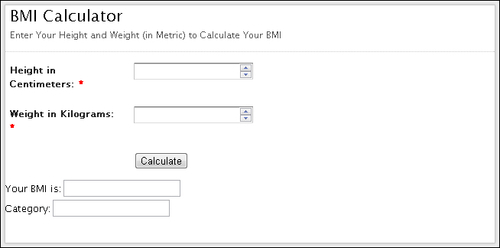
Here is an example of a BMI Calculator application page and HTML code written to render this page in a browser as displayed in the following screenshots:
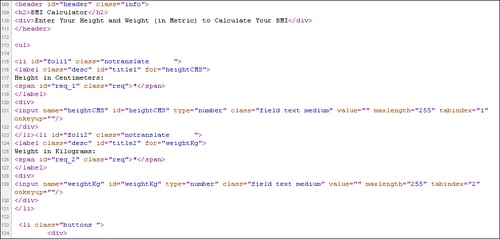
You can view the code written for a page by right-clicking in the browser window and selecting the View Page Source option from the pop-up menu. This will display the HTML code of the page in a separate window. This might look messy and difficult to understand.
We need special tools that can display this information in a structured and easy to understand format. In this recipe we will briefly explore few of these tools before we dive into locators.
In the following sections we will explore some of the tools which are in-built in browsers and plugins to analyze elements and page structure. These tools will help us to understand how elements and their attributes are defined on a page, DOM structure, JavaScript calls, CSS Style attributes, and so on.
Inspecting pages and elements with Firefox using Firebug add-in
The newer versions of Firefox provide in-built ways to analyze the page and elements; however, we will use the Firebug add-in which has more powerful features. You need to install the Firebug add-in in Firefox from https://addons.mozilla.org/en-us/firefox/addon/firebug/.
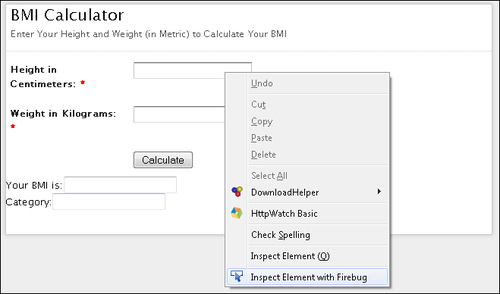
To inspect an element from the page, move the mouse over the desired element and right-click to open the pop-up menu. Select the Inspect Element with Firebug option as shown in the following screenshot:
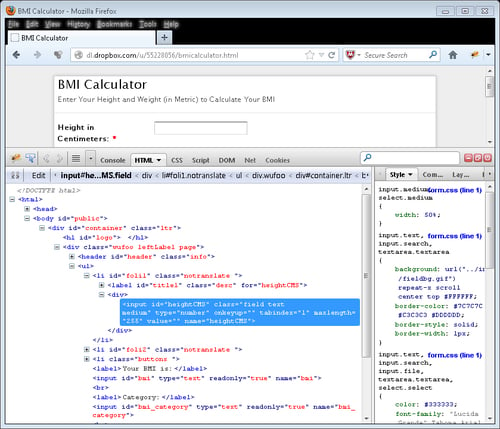
This will display Firebug with HTML code in a tree format as shown in the following screenshot:
Firebug provides various other debugging features. It also generates XPath and CSS selectors for elements. For this, select the desired element in the tree and right-click and select Copy XPath or Copy CSS Path option from the pop-up menu as shown in the following screenshot:
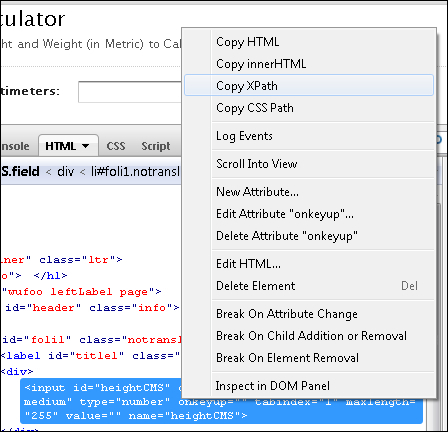
This will paste the possible XPath or CSS selector value on the clipboard.
Inspecting pages and elements with Google Chrome
Google Chrome provides an in-built feature to analyze pages and elements. This is very similar to Firebug. You can move the mouse over a desired element on the page and right-click to open the pop-up menu, then select Inspect element option. This will open Developer Tools in the browser, which displays information similar to that of Firebug, as shown in the following screenshot:
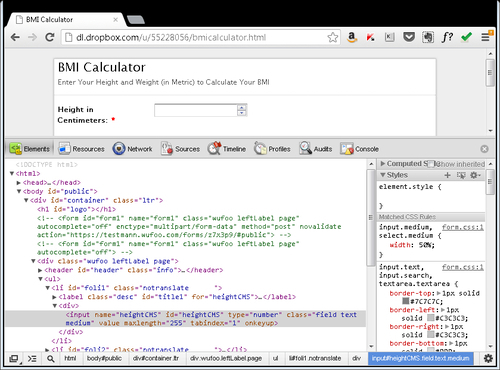
Chrome Developer Tools also provide a feature where you can get XPath for an element by right-clicking on the desired element in the tree and selecting the Copy XPath option from the pop-up menu.
Inspecting pages and elements with Internet Explorer
Similar to Google Chrome, Microsoft Internet Explorer also provides an in-built feature to analyze pages and elements.
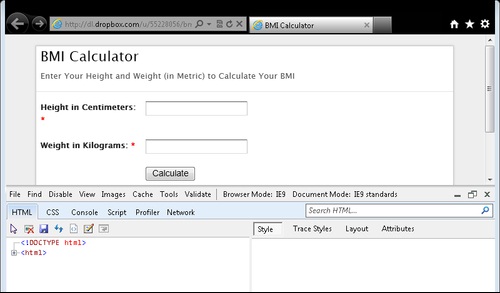
To open the Developer Tools, press the F12 key. The Developer Tools section will be displayed as shown in the following screenshot:
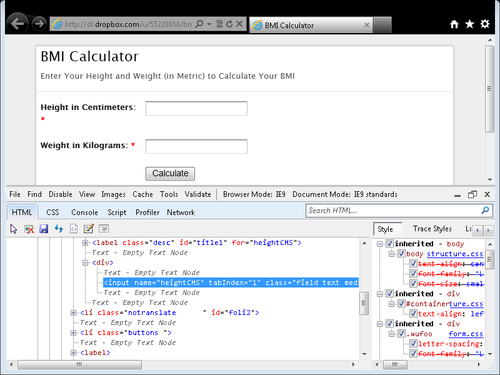
To inspect an element, click on the pointer ( ) icon and hover over the desired element on the page. Developer Tools will highlight the element with a blue outline and display the HTML code in a tree as shown in the following screenshot:
Browser Developer Tools come in handy during test development. These tools will help you in finding the locator details for elements. These tools parse the code for a page and display the information in a hierarchal tree. These tools also provide information on how styles have been applied, page resources, page DOM (Document Object Model), JavaScript code, and so on.
Some of these tools also provide the ability to run JavaScript code for debugging and testing.
In the following recipes we will explore various types of locators that are supported by Selenium WebDriver and these tools will help you in finding and deciding various locator strategies or methods provided by Selenium WebDriver API.