Book Image

The Business Analyst's Guide to Oracle Hyperion Interactive Reporting 11

By : Edward Cody
Book Image

The Business Analyst's Guide to Oracle Hyperion Interactive Reporting 11

By: Edward Cody

Overview of this book

Oracle Hyperion Interactive Reporting is one of the many products in the Oracle Enterprise Performance Management software suite, an industry-leading business intelligence software package. The primary focus of the Interactive Reporting product is to provide strong relational querying and data analysis capabilities. It also provides the capability to disseminate information throughout an enterprise. There is a very steep learning curve for most users of this tool.This book examines the power of the Interactive Reporting Web Client software, focusing on the key features of each section of the product. The author's experience in developing and supporting Interactive Reporting users is very well documented in this book. The goal is to educate you on every useful feature of the product, enabling you to gather information from various sources and process it to produce meaningful results that help you to spot problems and analyze trends necessary for business decisions.The book starts with a quick introduction to the product interface and the EPM Workspace, with explanation of importing and provisioning. It then takes you through each section from building a query and data model to building graphical displays of the data in a logical sequence. The report sections and interactive dashboards are also discussed at length. The book also covers advanced features of the product and provides you with the information necessary to build the foundation for creating complex queries and computations using the product.
Table of Contents (16 chapters)
The Business Analyst's Guide to Oracle Hyperion Interactive Reporting 11
Credits
About the Author
Acknowledgement
About the Reviewer
Preface
Index

Grouping columns


The Results and Table section provides the flexibility to group data into custom values. A grouping column is added to the section by highlighting a data column in the section, right-clicking, and selecting the Add Grouping Column menu item. Another method to add a grouping column is by highlighting the data column, clicking on the Results menu and selecting the Add Grouping Column menu item. After the menu item is selected, the Grouping Column window appears as shown in the following screenshot:

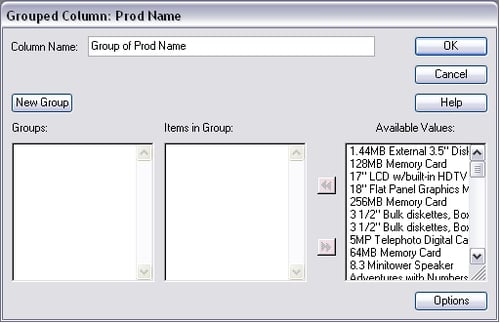
The first textbox at the top of the window is the name for the new column, which can be edited to rename the column to a user-defined value. The button below the column name textbox called New Group is used to add a group to the Groups listbox. Once groups are added to the Groups listbox, items can be assigned to the group. Items are assigned to each group by highlighting the group name in the Groups listbox and then highlighting items in the Available Values listbox and using the...