Book Image

The Business Analyst's Guide to Oracle Hyperion Interactive Reporting 11

By : Edward Cody
Book Image

The Business Analyst's Guide to Oracle Hyperion Interactive Reporting 11

By: Edward Cody

Overview of this book

Oracle Hyperion Interactive Reporting is one of the many products in the Oracle Enterprise Performance Management software suite, an industry-leading business intelligence software package. The primary focus of the Interactive Reporting product is to provide strong relational querying and data analysis capabilities. It also provides the capability to disseminate information throughout an enterprise. There is a very steep learning curve for most users of this tool.This book examines the power of the Interactive Reporting Web Client software, focusing on the key features of each section of the product. The author's experience in developing and supporting Interactive Reporting users is very well documented in this book. The goal is to educate you on every useful feature of the product, enabling you to gather information from various sources and process it to produce meaningful results that help you to spot problems and analyze trends necessary for business decisions.The book starts with a quick introduction to the product interface and the EPM Workspace, with explanation of importing and provisioning. It then takes you through each section from building a query and data model to building graphical displays of the data in a logical sequence. The report sections and interactive dashboards are also discussed at length. The book also covers advanced features of the product and provides you with the information necessary to build the foundation for creating complex queries and computations using the product.
Table of Contents (16 chapters)
The Business Analyst's Guide to Oracle Hyperion Interactive Reporting 11
Credits
About the Author
Acknowledgement
About the Reviewer
Preface
Index

Arranging label content


The Pivot section provides flexibility to easily modify and rearrange content while performing analysis. The first and most commonly used method of rearranging content is the ability to easily move row and column element in the pivot. Row and column elements are rearranged by dragging-and-dropping elements in the Data Layout, or by highlighting and moving the column of data in the physical pivot.

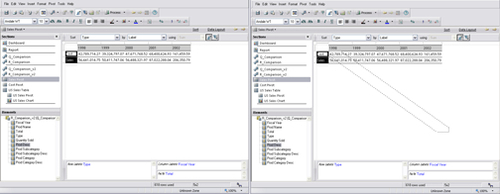
A tab exists at the end of each row and column label allowing for the highlighting of the entire column as shown in the following screenshot. When the element is highlighted, the column can be pivoted from the row labels to the column labels, and the row and column labels can be rearranged respectively by dragging the element in front or behind other sections. When the element is dragged, a graphical outline appears as shown in the following screenshot: