Book Image

Microsoft Dynamics GP 2010 Reporting

Book Image

Microsoft Dynamics GP 2010 Reporting

Overview of this book

Resources such as the book you now hold in your hand are critical to taking the extra step in uncovering the trends locked deep within your data. Not only will this book offer insight into the many reporting tools currently available for GP, it will also offer a unique perspective on how each reporting tool can be used to meet specific challenges faced by your organization" - Errol Schoenfish, a member of the Microsoft Dynamics community for over 24 years Microsoft Dynamics GP 2010 is a sophisticated Enterprise Resource Planning (ERP) system with a multitude of features and options. Microsoft Dynamics GP enables you to create and manage a variety of reports that help small and mid-size businesses effectively manage their financial and operational data. This book will show you how to create and manage reports, know what tools to use and when, how to use them and where to find the data based on how it's being entered into the system with Dynamics GP. This book will empower you with the tools and reports necessary to use Dynamics GP data in making key business decisions. The book addresses the many challenges and frustrations a company may face when preparing to build new reports. Then it moves on to explain how to find your data in the GP system and company databases. The book then dives deep into topics such as SmartLists, SL Builder and Excel Report Builder, Report Writer, SSRS Report Library, and Analysis Cubes Design and Management Reporter amongst others. With this knowledge in hand, you will be capable of selecting the most effective tool for the current reporting environment.
Table of Contents (21 chapters)
Microsoft Dynamics GP 2010 Reporting
Credits
Foreword
About the Authors
Acknowledgement
Acknowledgement
About the Reviewers
www.PacktPub.com
Preface
Index

Understanding the components of the Analysis Cubes environment


The Analysis Cubes product offering is composed of several different components, each of which can be modified and customized to fit the needs of our organization. Although each of these components plays a critical role in the overall end-product, understanding how each component works in relation to the others can be challenging. Fortunately for us, the components that make up the cubes are fairly well-known as they are spread across the Microsoft SQL Server stack.

Let's take a look at the various components that comprise the Analysis Cubes environment. Our next image shows an overview of an Analysis Cubes solution deployed in an environment containing three separate GP company databases:

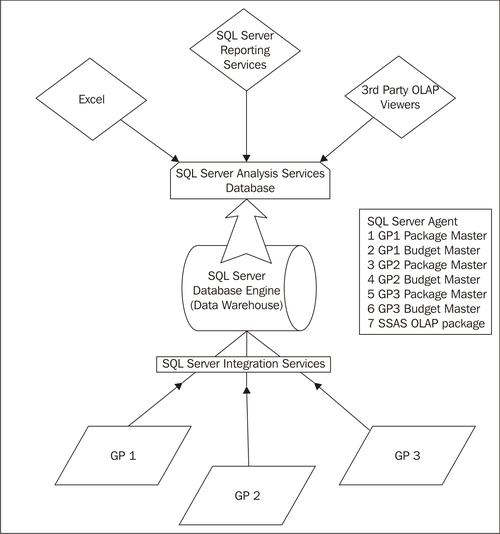
From this image, we can see the various components and their connections to each other. Notice how the users are connecting to the SQL Server Analysis Services database via viewers such as Microsoft Excel, SQL Server Reporting Services, or any...