

Creating Excel reports using work item queries is one of the easiest ways to generate custom reports. Excel reports via a work item query let you generate status and trend graphs. Once the reports are generated, data can be manipulated by adding or filtering the fields using a PivotTable.
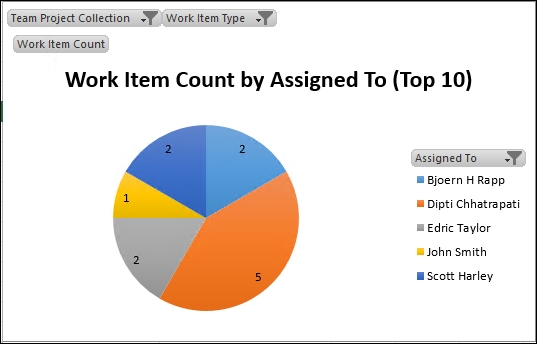
The following diagram shows the item count per member generated by a flat query list:
The following are the steps to generate Excel reports using a flat query list:
Open the flat query list, in Team Explorer in Visual Studio, that contains the items to be reported. For example, the All Tasks shared query considers all work items to have the task type as displayed in the following screenshot:

Create a report in Microsoft Excel from the query results view:

Select the desired details for the report to be generated.

Click on Finish and wait until Excel completes the report generation process.
As a result, Excel reports, in which every worksheet shows...