Book Image

QGIS 2 Cookbook

By : Alex Mandel, Víctor Olaya Ferrero, Anita Graser, Alexander Bruy
Book Image

QGIS 2 Cookbook

By: Alex Mandel, Víctor Olaya Ferrero, Anita Graser, Alexander Bruy

Overview of this book

QGIS is a user-friendly, cross-platform desktop geographic information system used to make maps and analyze spatial data. QGIS allows users to understand, question, interpret, and visualize spatial data in many ways that reveal relationships, patterns, and trends in the form of maps. This book is a collection of simple to advanced techniques that are needed in everyday geospatial work, and shows how to accomplish them with QGIS. You will begin by understanding the different types of data management techniques, as well as how data exploration works. You will then learn how to perform classic vector and raster analysis with QGIS, apart from creating time-based visualizations. Finally, you will learn how to create interactive and visually appealing maps with custom cartography. By the end of this book, you will have all the necessary knowledge to handle spatial data management, exploration, and visualization tasks in QGIS.
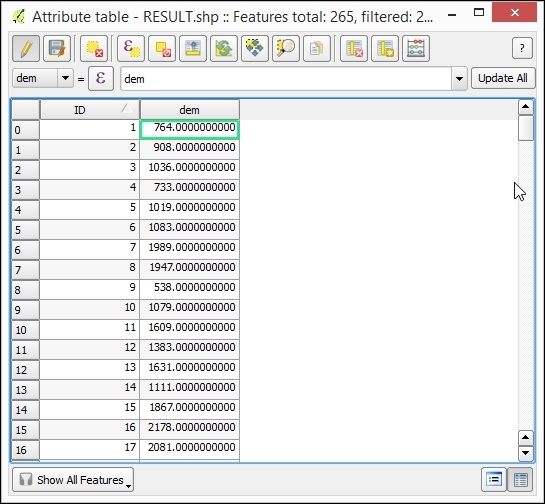
Table of Contents (19 chapters)
QGIS 2 Cookbook
Credits
About the Authors
About the Reviewers
www.PacktPub.com
Preface
Index

Sampling a raster layer


Data from a raster layer can be added to a points layer by querying the value of the layer in the coordinates of the points. This process is known as sampling, and this recipe explains how to perform it.

Getting ready

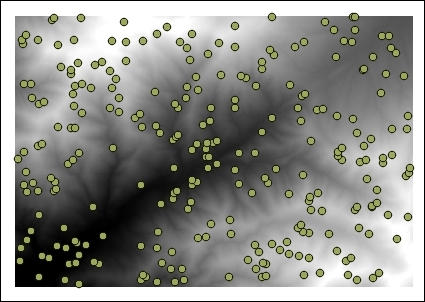
Open the dem.tif raster layer and the dem_points.shp vector layer:

How to do it…

  1. In the Processing Toolbox menu, find the Add grid values to points algorithm and double-click on it to open it:

  2. Select the DEM in the Grids field.

  3. Select the point layer in the Points field.

  4. Click on Run to run the algorithm.

A new vector layer will be created. This contains the same points as the input layer, but the attribute table will have an additional field with the name of the selected raster layer and the values corresponding to this layer in each point:

How it works…

The coordinates of the points are taken, and the value of the pixel in which the layer falls is added to the resulting points layer.

This method assumes that the value of a cell is constant in all the area covered...