

In this section, you will learn how to make a layer and data frame time-enabled. You will then add a tool to the Migration Patterns toolbox that cycles through the time range for the layer and exports a PDF map showing the movement of the elk over time and space:
If necessary, open
C:\ArcGIS_Blueprint_Python\ch2\ElkMigration.mxdin ArcMap.First, we'll symbolize the features so that we display them differently for wet and dry seasons. Right-click on the
Betsyfeature class and select Properties.Click on the Symbology tab and then define the symbology, as shown in the following screenshot:

Now, select the Time tab, as shown in the following screenshot:
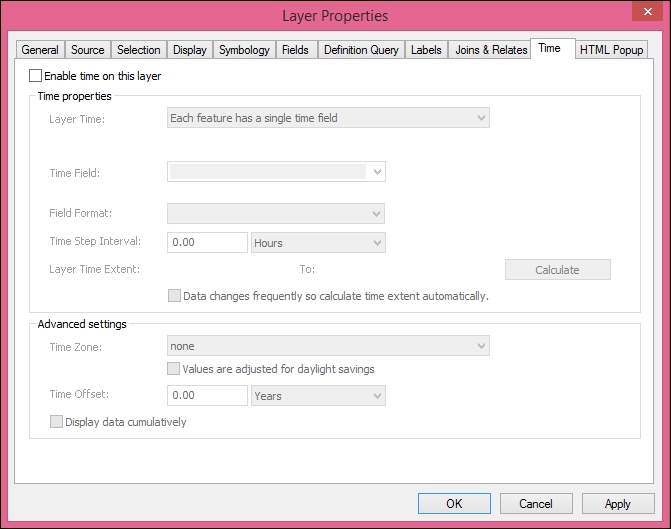
Enable the time for the layer by clicking on the Enable time for this layer checkbox.
Define Layer Time Extent by clicking on the Calculate button.
Under Time properties, select Each feature has a single time field for Layer Time. Select the
datefield for Time Field. Define a Time Step Interval of 1 Days...