

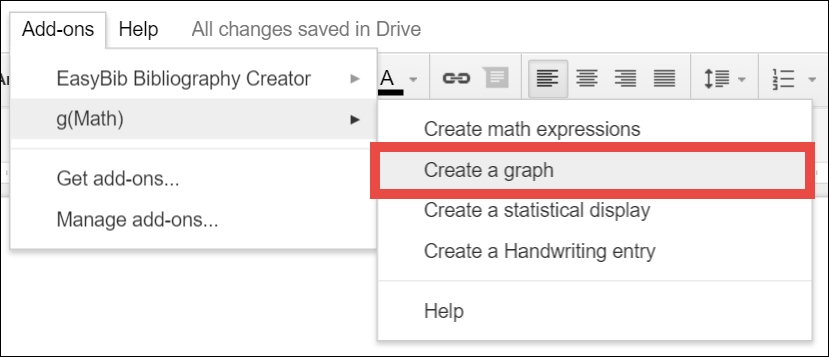
An add-on that can also create equations is g(Math). It uses the LaTex language to create images of equations, which can be pasted into a Google Docs document. g(Math) can also plot graphs in Google Docs. It needs to be installed as an add-on using the same instructions found in the Creating citations with EasyBib section at the start of this chapter. Once g(Math) is installed, use these steps to plot a graph:
Select Create a graph from g(Math)'s submenu:
Enter the graph equation in the Functions field:

For additional mathematical constants, scroll down and click on the constants to insert them into a function. An screenshot of the list of constants and functions is shown as follows:

Scrolling to the bottom of the sidebar provides additional options such as plotting individual points on the graph, displaying the y-axis, and displaying grid lines:

In the middle of the sidebar, there are Graph Zoom Region settings, which determine the domain and range of the...