Book Image

Building Dashboards with Microsoft Dynamics GP 2016 - Second Edition

By : Mark Polino
Book Image

Building Dashboards with Microsoft Dynamics GP 2016 - Second Edition

By: Mark Polino

Overview of this book

Microsoft Dynamics GP is a complete ERP solution that is extremely beneficial for small to midsize organizations in helping them grow exponentially. The book shows you in detail how to build great-looking dashboards with Microsoft Dynamics GP that enhance a company’s decision-making processes. This guide will take you from the basics of setting up and deploying to creating secure, refreshable Excel reports. Using a whole host of tools available within Microsoft Dynamics GP and Excel, this tutorial will show you how to visualize your data using simple conditional formatting techniques and easy-to-read charts, and allow you to make your data interactive with slicers. We will also cover core topics such as Business Analyzer, Microsoft SQL Reporting services reports, BI360, and more. You will find out to use Power BI, share and refresh data and dashboards in Power BI, and use Power BI Query Editor. By the end of this book, you will have all the information required to build interactive dashboards using Dynamics GP.
Table of Contents (22 chapters)
Building Dashboards with Microsoft Dynamics GP 2016 Second Edition
Credits
About the Authors
About the Reviewer
www.PacktPub.com
Customer Feedback
Preface
Index

SQL Server Reporting Services


Microsoft provides prebuilt SSRS reports as part of Dynamics GP 2016. Deploying SSRS reports is included as an option during installation, but they can also be installed later. SSRS provides an easy path to send information to Microsoft Excel 2016.

To demonstrate this, start in Dynamics GP 2016 and follow these steps:

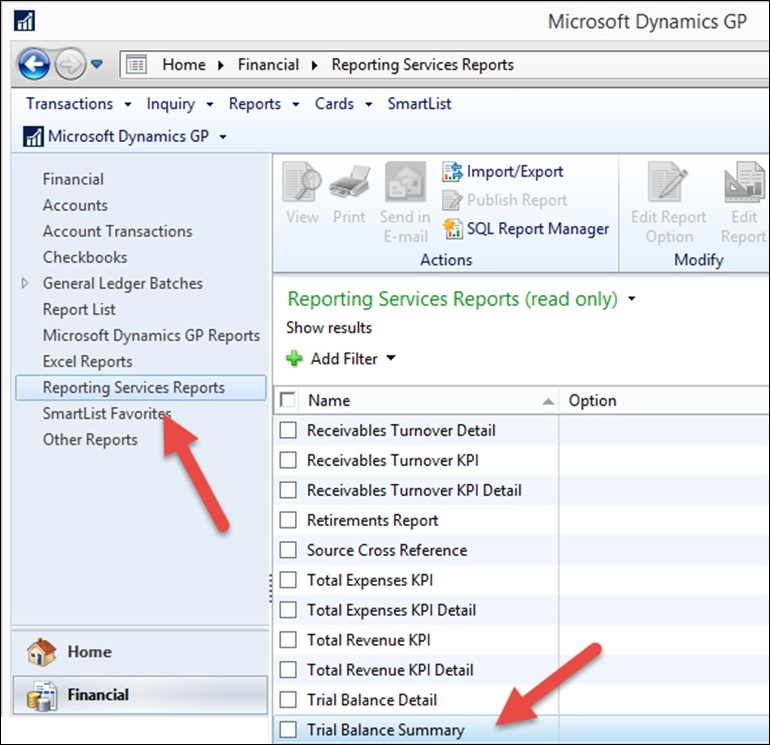
  1. Select Financial from the navigation pane on the left-hand side.

  2. In the list pane which is above the navigation pane, click on Reporting Services Reports.

  3. In the center pane, scroll down and find Trial Balance Summary.

  4. Double-click on Trial Balance Summary to open the report:

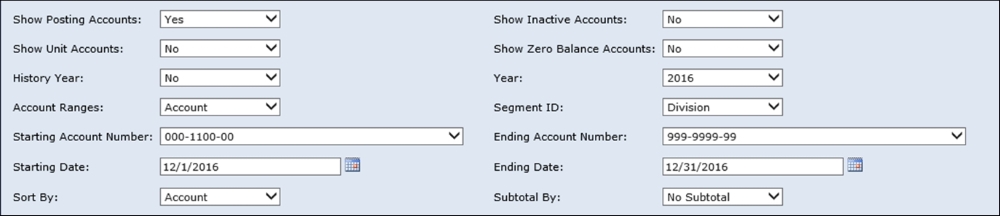
  5. Once the report opens in a web browser, change the following criteria:

    • History Year: No

    • Year: 2016

    • Starting Account Number: 000-1100-00

    • Ending Account Number: 999-999-99

    • Starting Date: 12/01/2016

    • Ending Date: 12/31/2016

    • Sort By: Account

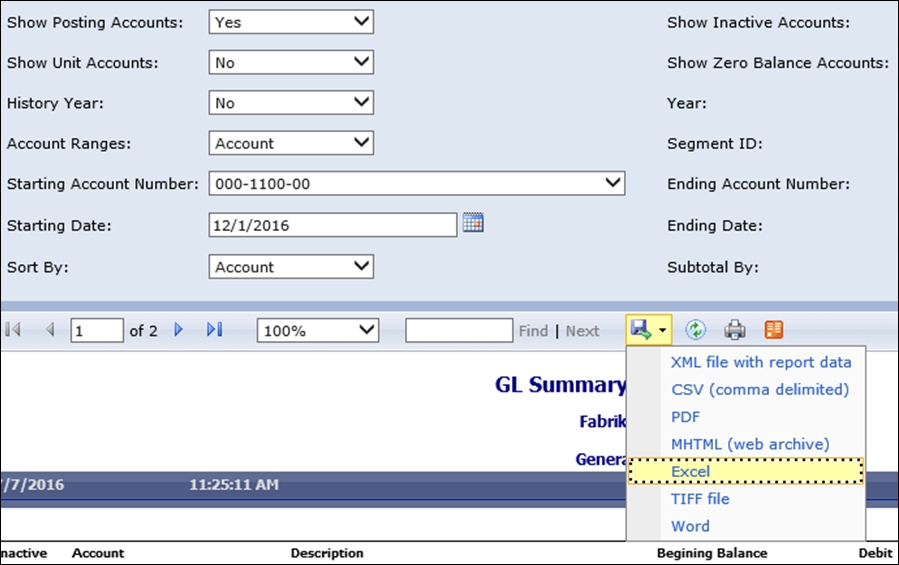
  6. Click on View Report in the upper-right corner to run the Trial Balance Summary.

  7. Select the disk icon and click on Excel:

  8. If a security bar opens at the bottom asking Do you want to open or save..., select Open.

  9. The Trial Balance Summary report now opens in Excel 2016.