

Shortly after the release of Microsoft Dynamics GP 2016, Microsoft announced that the financial report writer, Management Reporter, was going into maintenance mode. This meant bug fixes would continue, but there would be no new features added. A large reason for this was Management Reporter's inability to go to the cloud. Entering this situation, Jet Reports to the rescue, offering a special release of the Express product to GP users free of charge.
What is Jet Reports? Jet Reports has an Excel add-on that enables Jet to work directly with your GP data in SQL. So, it's actually Excel that you are using to build reports. You may be wondering why wouldn't we build them in Excel directly. We asked that question. Once we used the product the first time, we had our answers:
The deliverable report shows no signs of how or where the connection occurred. In the past, we've written a lot of complex Excel reports for customers. More often than not, they have to keep referring to the original copy as they somehow blow away some of the settings. Jet allows the report recipient (viewer) to see only Excel formulas such as
SUM, not the connection information. This not only allows for tighter security; it makes the reports easier to consume.Changing from one company to the next is just three clicks.
These are just our personal reasons.
There are two elements of this free product: General Ledger (Basic) Financial Report writing and the Jet Table Builder. I'll cover these in more detail in Chapter 6, Introducing Jet Reports Express, and Chapter 7, Building Financial Reports in Jet Express for GP. Meanwhile, let's take a quick peek at how data flows into Excel from GP via Jet Express.
I also want to point out that Jet Reports will enable you to use your local version of Excel (installed on your computer) with your GP data. Jet Reports will work even if your GP data is in the cloud (hosted by a service data center or hosted in Azure.) The configuration to connect to your data is relatively simple, but outside the scope of this book.
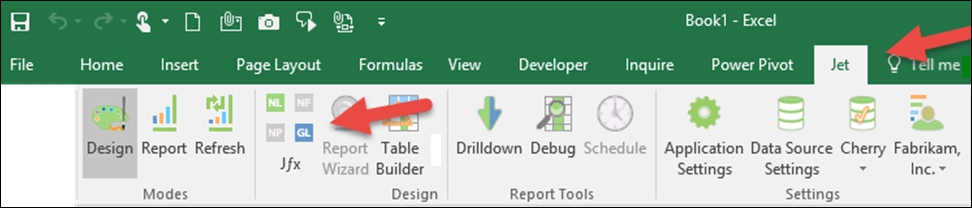
After Jet Reports is installed and configured, Jet will appear on the Menu bar in your Excel. Once Jet is clicked, the Jet ribbon will open. For financial statements, we only need the balance of accounts, so we would use the GL function to start building our statements:
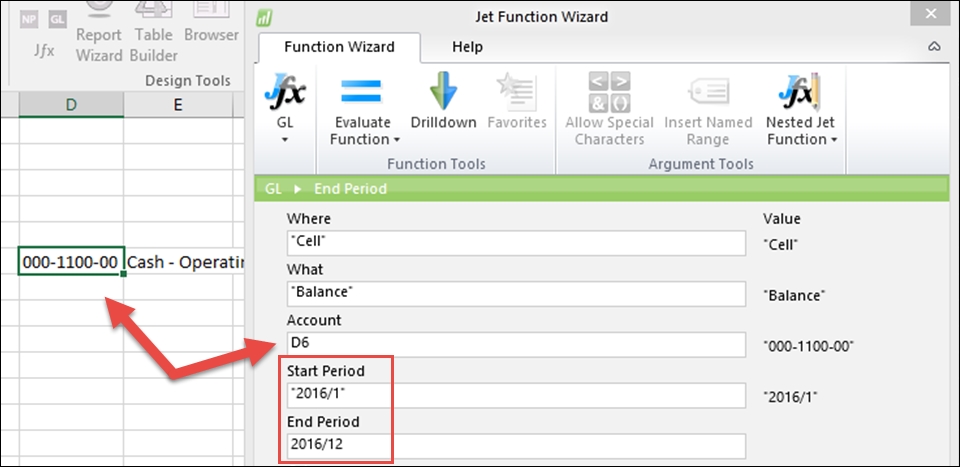
Clicking on the GL function will open the Jet Function Wizard window. Using the wizard will allow you to simply "fill in the blanks." In the following screenshot, I've selected that we want to see a row for a range of accounts (000-1100-00 through 000-1140-00). There are also fields to add the criteria of a GL Account category(s), Budget, or to select a specific company (if we want to have a consolidated financial statement.) This will populate Excel with the account numbers:

To display the account name, we'll open the GL function window again and "fill in the blanks". We add a cell reference next to the number, select AccountName, and point to the Account Number cell:

Finally, I'll use the GL function to add the account balance. We select cell, Balance, and reference the Account Number cell like we did earlier. I'll also select the period for which we want to report. I'll select the year 2016 for periods 1 through 12, allowing us to capture the entire year:
My Excel worksheet now looks like the following screenshot, as we are working (by default) in the Design mode. You'll notice that for each Excel cell that we entered data using the GL function wizard, a formula appears in the formula bar. Just as in native Excel, once you become familiar with the formula, you can skip the wizard window and enter the formula directly if you like. In cell A1, Jet entered some commands. This will automatically hide column A, so we can use it in formulas if we like:

Once we click on the Report mode, Jet retrieves all the data requested and displays the accounts, account names, and balances we requested:

Back in the
Design mode, I'll quickly perform some normal Excel formatting and add a Sum function:

By clicking on the Report mode again, our simple report of Cash looks ready for presentation:

As mentioned earlier, in Chapter 7, Building Financial Reports in Jet Express for GP, we'll walk together through building a financial statement.
The Table Builder in Jet Reports retrieves data from GP in a similar wizard-driven fashion, like the GL function earlier. It's easy to use, so I'll just reference you to Chapter 6, Introducing Jet Reports Express. We need to give you some reason to keep reading.