Book Image

GeoServer Beginner's Guide - Second Edition

By : Stefano Iacovella
Book Image

GeoServer Beginner's Guide - Second Edition

By: Stefano Iacovella

Overview of this book

GeoServer is an opensource server written in Java that allows users to share, process, and edit geospatial data. This book will guide you through the new features and improvements of GeoServer and will help you get started with it. GeoServer Beginner's Guide gives you the impetus to build custom maps using your data without the need for costly commercial software licenses and restrictions. Even if you do not have prior GIS knowledge, you will be able to make interactive maps after reading this book. You will install GeoServer, access your data from a database, and apply style points, lines, polygons, and labels to impress site visitors with real-time maps. Then you follow a step-by-step guide that installs GeoServer in minutes. You will explore the web-based administrative interface to connect to backend data stores such as PostGIS, and Oracle. Going ahead, you can display your data on web-based interactive maps, use style lines, points, polygons, and embed images to visualize this data for your web visitors. You will walk away from this book with a working application ready for production. After reading GeoServer Beginner's Guide, you will be able to build beautiful custom maps on your website using your geospatial data.
Table of Contents (20 chapters)
Title Page
Credits
About the Author
About the Reviewer
www.PacktPub.com
Customer Feedback
Preface
Index

Modelling the real world with raster data


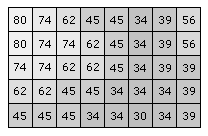
Raster data uses a regular tessellation, defining cells where one or more values are uniform. Usually, the cells are square; although, this is not a constraint. Raster data is generally used to represent values continuously changing in the space, that is, a field. You can use a regular tessellation to build a digital elevation model of the Earth's surface. In the following figure, each cell has a height and width of 20 meters, and the value stored is the height above sea level in meters:

Can you use raster data to model real features, such as a river? Yes, you can, but there are some drawbacks you have to consider. The following figure shows a linear feature represented as vector data (the red line) and as raster data (the black and white cells). If your purpose is drawing the shapes on a map, raster data is not a good choice, as raster graphics are resolution dependent. They cannot scale up to an arbitrary resolution without the apparent loss of quality.