
In the previous sections, we explored spatial data and SRS. They are the key elements you need to build your map. Indeed, maps are a planar representation of spatial data. You need to collect the appropriate data to represent the real objects you want to include in your map, and you need to choose an SRS to organize your data onto the map.
Keep in mind that maps are representations, a proposition of yours. They are the way you express your knowledge and your vision of the world. To fully accomplish this, there is a third basic ingredient for your map: symbology.
Symbology enables you to add information to the features shown on a map. For example, colors can be used to indicate a classification of roads. Imagine you need to produce a map of a country with a road network. You have a vector dataset containing road polylines. A simple approach is to render all features with the same symbol, as shown in the following figure. The map is not really informative unless you are a transportation expert. You won't extract any information from the map and it looks ugly too.

Let's take a look at a similar map produced with ArcGIS Online (http://www.esri.com/software/arcgis/arcgisonline).
It contains the road network symbolized with different colors and line widths, labels showing you highway codes, and major towns represented with small circles and labels. Besides, there is a background depicting heights with colors and shading. Does it now look more familiar to you?

In Chapter 6, Styling Your Layers, you will learn how to apply symbols in GeoServer to produce maps like the previous one. For now, you need to familiarize yourself with simple and thematic maps.
Are you ready to explore some nice maps? We will navigate through a great bunch of spatial data, OpenStreetMap. Perform the following steps:
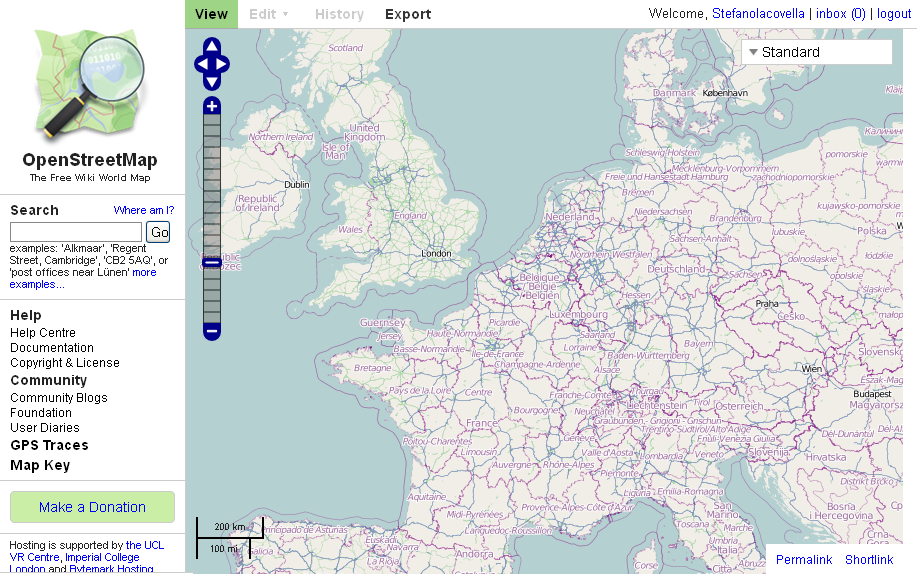
- Open your browser and go to http://www.openstreetmap.org.
- The website offers you a small scale map centered on your actual location, as derived from the browser information:
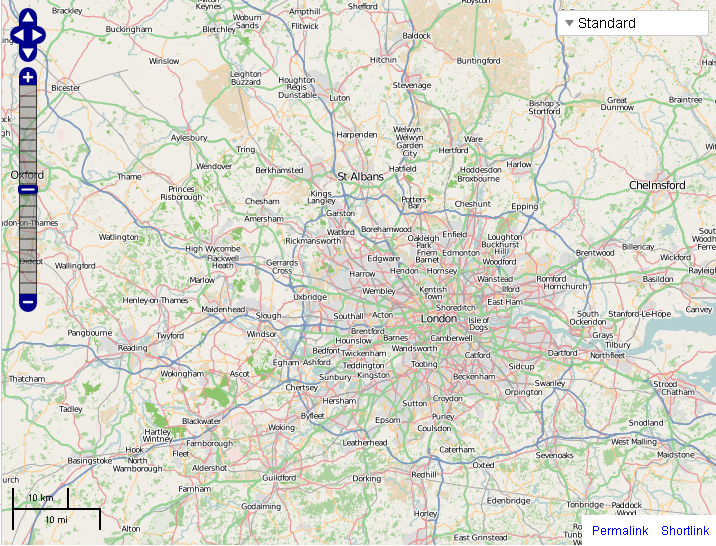
- Center your map on London, UK, and zoom in with the tool shown on the left-hand side. You can see that many more road types and locations are now shown in this map:
- Now, enter the
Piccadilly Circus, London, UKaddress in theSearchtextbox on the left and click on theGobutton. A list of results matching your search is presented on the left side of the map. Pick the first item:

- The map is now at a great scale (look at the scale bar on the bottom-left of the map panel) and the symbols changed to show you greater detailed information about roads and locations. You can find street names, directions for car traffic, buildings' footprints, and icons for points of interest. The general look and feel resemble a printed city map you can pick up at tourist offices.
Note
OpenStreetMap does not require you to register for browsing or exporting the data. Anyway, if you are interested in maps and open source data, you may consider getting involved in the project. OSM is a collaborative project to create a free editable map of the world, currently involving over half a million users all around the world. You may add data or find errors on locations you know well.
You explored several maps representing the same data set in quite different ways. Different symbols and hiding subsets of data are powerful tools to produce clear and nice looking maps. You are now ready to discover a different kind of map.