
A functional consultant, usually someone without technical or development skills, has the ability to set up dimensions in Dynamics NAV. With these dimensions, reports can be created and customized: Chart of Accounts Analysis, Account Schedules, Analysing Financial Information Using Dimensions, and Exporting Analysis Views. Some of these reporting tools provide functionality to export information to Microsoft Excel. You could say that this is Dynamics NAV 's built-in Business Intelligence tool.
Basically, a dimension is data added to an entry so that entries with similar characteristics can be grouped and easily retrieved for analysis purposes. Dimensions can be used throughout Microsoft Dynamics NAV on entries in journals, documents, ledgers, and budgets.
You must allocate adequate time when setting up the dimensions in Microsoft Dynamics NAV. The dimensions structure must be determined in combination with the chart of accounts and posting group structure. Additionally, using dimensions and simplifying the chart of accounts provides a better analysis of financial information. Getting this right in the beginning of an implementation is important because, changing the ways that dimensions are set up a long time after Go Live is not an easy job…
Technically, dimensions are values added to an entry to act as markers for the program, which allows entries with similar dimension values to be grouped for analysis purposes.
Metadata is data about your data, like attributes that you define and link to your data (entries). You can then use these dimensions for reporting purposes.
Many different types of entries in the program can have dimensions, including the following:
Master records
Transaction document headers and lines
Journal lines
Ledger entries
Posted documents and their lines
Each dimension can have an unlimited number of dimension values. For example, a dimension called Department can have dimension values of Sales, Administration, Purchasing, and so on. Users define and tailor these dimensions and values to their company's needs.
Tip
Dimension setup
Setting up dimensions in Dynamics NAV should be considered a job for experienced consultants. Just because Dynamics NAV allows you to create an unlimited amount of dimensions, that does not mean that you should. When you create dimensions without proper understanding of the business process and the reporting requirements of the customer, that will lead to Dynamics NAV collecting a massive amount of information and in the end it might bring confusion instead of a better understanding. The key is to keep it simple.
In Dynamics NAV, there are three types of dimensions:
Global
Shortcut
Budget
Global dimensions are the most used and important dimensions because of their availability throughout Microsoft Dynamics NAV. Two dimensions can be specified as global dimensions.
Global dimensions can be used as filters for the following:
G/L entries
Reports
Account schedules
Batch jobs
Both global dimensions are also available as Shortcut Dimensions 1 and 2 for use on the following:
Document headers
Entry lines
When setting up dimensions in the G/L Setup, two of them can be global dimensions. These dimension types can be used throughout the program as a filter for G/L entries and on reports, account schedules, and batch jobs. Global dimensions are the only dimensions that are stored as part of the tables they describe. For instance, the G/L Entry table has two fields for the global dimensions.
Shortcut dimensions are used to enter dimensions and dimension values directly on the lines in the following:
Journals
Sales and purchase documents
There are a total of eight shortcut dimensions available. The first two shortcut dimensions are automatically defined as global dimensions. The remaining six shortcut dimensions are selected from the dimensions previously set up and can be changed regularly, as needed.
Use either of the following methods to assign dimensions to document entry lines:
Enter dimension values for a dimension directly on the line by using the Choose Column function to add shortcut dimensions to the lines.
Enter dimensions information in the Document Dimensions page by clicking the Actions menu (lightning bolt icon) on the Lines Fast Tab, pointing to Line, and then clicking Dimensions.
When you enter shortcut dimensions on journal and document lines, these lines have eight fields that are designated for dimensions. The first two are always the global dimensions, but the remaining six can be selected from those set up as shortcut dimensions in the G/L Setup. Dimensions that are not set up as shortcut dimensions can also be specified, but these must be set up in a separate Dimensions window for the header or line. Shortcut dimensions that are not set up as global dimensions are not stored as actual fields of the tables they describe. Instead, they are stored in a separate table.
Where dimensions are stored depends on the type of entry. The following table shows different tables that contain dimensions with the types of entries with which they are associated:
|
Dimension Table |
Type of Entry |
|---|---|
|
352 Default Dimension |
Master records |
|
355 Ledger Entry Dimension |
Ledger entries |
|
356 Journal Line Dimension |
Journal lines |
|
357 Document Dimension |
Document headers and lines |
|
358 Production DocumentDimension |
Production orders, lines, and components |
|
359 Posted Document Dimension |
Posted document headers and lines |
|
361 G/L Budget Dimension |
Budget entries |
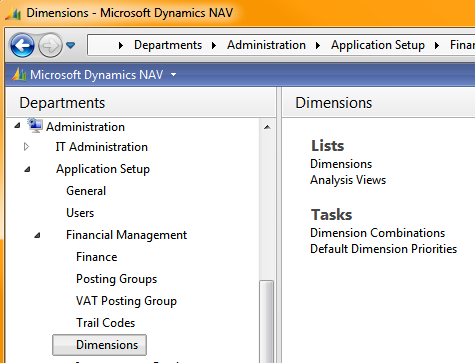
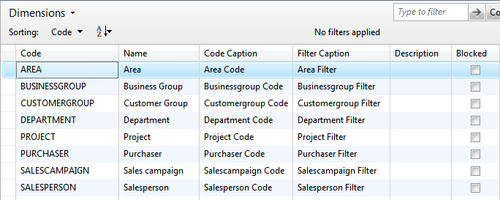
Dimensions are set up under the Administration area in the Departments, under Administration\Application Setup\Financial Management\Dimensions. For each dimension, a code, a name, a code caption, and a filter caption are defined.
Global dimensions and shortcut dimensions are set up under General Ledger Setup, under the Dimensions Fast Tab. For the standard CRONUS International Ltd. demonstration database, the global dimensions have been set to the Department and Project dimensions, as shown here:
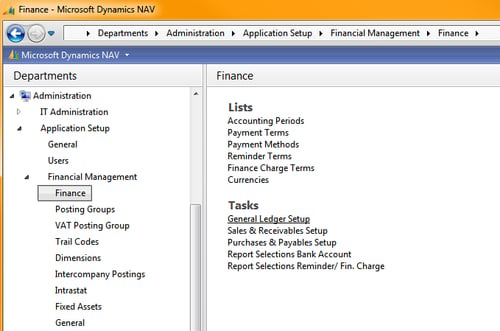
When you click on General Ledger Setup, the following window opens:
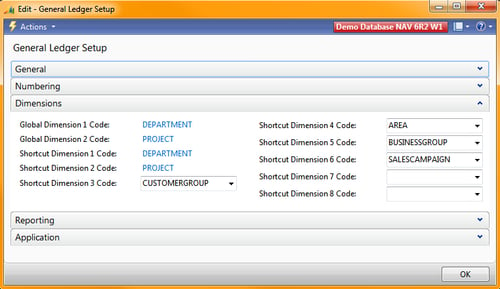
Global Dimensions 1 and 2, if set up in the system, will now link to these two dimensions. For example, the Global Dimension 1 Code field in the Customer table will now have a caption of Department Code, because this dimension is set up as the Global Dimension 1 Code in General Ledger Setup.
The aspects of defining and setting up dimensions include:
Dimension values
Dimension combinations
Default dimensions
Default dimension priority
Dimensions are an integral aspect of Microsoft Dynamics NAV and are used throughout the product. The ability to set up the various types of dimensions and dimension values helps companies tailor their reporting needs to their business, and through the use of dimension defaults, combinations, and priorities, companies can retain control of how dimension entries are posted. Setting up and using dimensions properly initially assists in achieving better financial analysis results later.
Each dimension can have an unlimited series of dimension values. For example, a dimension called Department can have the dimension values Sales, Administration, and so on, as department names.
Dimensions and dimension values are user-defined and unlimited, which means dimensions are tailored for each company.
Tip
Too many dimensions cause performance issues
Be careful not to create too many dimensions and dimension values. The more dimensions that you allow and use, the more dimension information that will be stored in the database and this might have a very negative impact on performance. In most cases it is recommended not to use more than four or six dimensions.
To access the dimension setup, click on the link in the Departments suite as shown in the previous screenshot. If you do not find the link in the Departments suite then as an alternative you can type the name into the search box at the top right of the RTC. The following window will open:
A dimension value:
Dimensions and dimension values make it possible to:
Users can create a hierarchical relationship between dimension values so that Microsoft Dynamics NAV will consider some dimension values as subsets of another dimension value. This relationship is achieved using dimension value types.
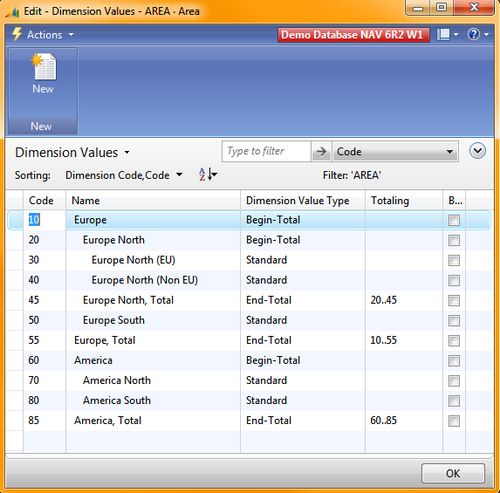
Dimension values are set up in the Dimension Values page, located on the Dimensions page by clicking the Related Information menu, pointing to Dimension, and then clicking Dimension Values.
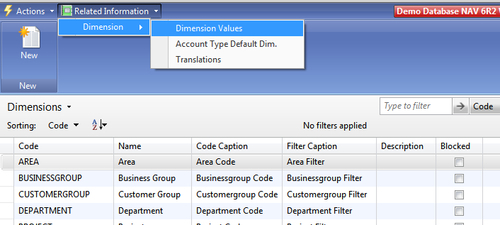
When you select the option Dimension Values, as shown in the screenshot above, then the following window opens:
The explanations of how to use the fields are in the following table:
|
Field |
Description |
|---|---|
|
Code |
Unique code for the dimension value. |
|
Name |
Descriptive name for the dimension value. |
|
Dimension Value Type |
Determines the manner in which a dimension value is used when posted. The options are:
|
|
Totalling |
Identifies a dimension value interval or a list of dimension values, used to total the entries for the dimension values displayed in the field to give a total balance. |
|
Blocked |
Used to block the posting of journals containing specific dimension values. |
The Dimension Value Type and Totalling fields together create the hierarchical relationship in dimension values:
|
Option |
Description |
|---|---|
|
Standard |
Used for standard posting of dimension values |
|
Heading |
Heading for a group of dimension values |
|
Total |
Used to total a series of balances on dimension values that do not immediately precede the Total dimension value |
|
Begin Total |
Marker for the beginning of a series of dimension values to be totalled and ends with an End-Total dimension value type |
|
End Total |
Total of a series of dimension values that starts with the dimension value type Begin-Total |
The Totalling field is completed based on the selection made in the Dimension Value Types field:
If the dimension value type is Standard, Heading, or Begin-Total, the Totalling field must be blank
If Total is selected, the Totalling field must be manually populated to indicate which dimension values will be totalled
If End-Total is selected, the Totalling field is automatically populated when the Indent Dimension Values function is run
The Indent Dimension Values function:
Indents all dimension values between a Begin-Total and the matching End-Total by one level
Totals all dimension values within the same range and updates the Totalling field for each End-Total
You can access the Indent Dimension Values function from the Dimension Values page by clicking the Actions menu, pointing to Functions, and then clicking Indent Dimension Values.
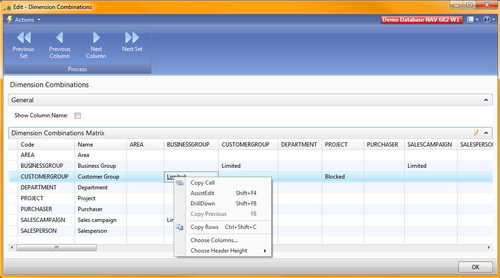
Dimension combinations provide the ability to prevent (block) particular dimensions from being combined on a journal or in a document, and under what circumstances. The blocking may be, for example, that a specific project team cannot post certain expense types or that a certain item cannot be sold in a particular area.
In addition, the use of a particular dimension combination can be restricted, depending on which dimension value combination is being used for the two dimensions.
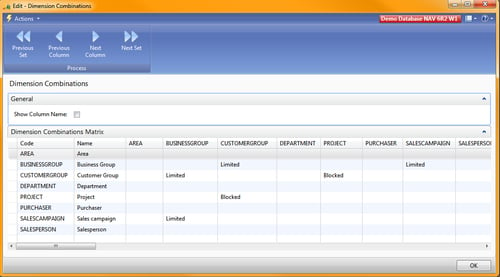
This page displays a matrix of all combinations of dimensions created in Microsoft Dynamics NAV. The dimensions displayed in the rows of the matrix are also represented as dimension columns.
The columns in the Dimension Combinations Matrix are called combination restriction fields. The combinations for these fields are accessed by clicking the field, and include the options shown in the following table:
|
Option |
Description |
|---|---|
|
No Limitations |
The dimension combination is always allowed on entries. This is the default setting for dimension combinations. |
|
Limited |
The dimension combination is only allowed in certain circumstances, depending on which dimension values are selected when you are creating an entry. |
|
Blocked |
The dimension combination is excluded from use on entries. |
Tip
If the Limited option is selected, the restricted dimension value combinations must be specified. Dimension value combinations are only applicable to the Limited option.
Dimension value combinations are set up by drilling down in the relevant restriction field on the Dimension Combinations Matrix to define restrictions in the Dimension Value Combinations Matrix page.
When you click on Drilldown, the following window opens:
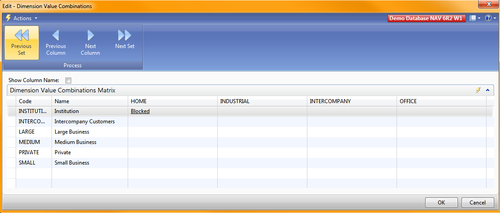
The Dimension Value Combinations Matrix page is a matrix of all combinations of dimension values for a particular dimension combination. The rows represent the dimension values of the dimension selected in the rows of the Dimension Combinations Matrix page. The columns represent the dimension values of the dimension selected in the column of the Dimension Combinations Matrix page. The dimension value combination restrictions are set up by clicking the relevant field and selecting Blocked. If Blocked is not selected, the combinations are allowed for these dimension values.
You can minimize the data entry involved in recording dimension information by assigning default dimensions to accounts, customers, vendors, items, and other objects in Microsoft Dynamics NAV. Once you have set up default dimensions for an account, those dimensions and related values will automatically be filled in whenever the account is used, but the dimension values can still be changed if required.
Users can specify default dimensions in various ways:
For an individual account on the relevant account card
For a particular group of accounts within an account type by using the Default Dimension—Multiple menu item on an account list, such as the Vendor List
For an entire account type, such as the customer account type, in the Account Type Default Dim. Page
Account type default dimensions can be used, for example, to ensure that a company-defined dimension called Customer Group is always used for customer accounts. Default dimensions can suggest conflicting dimension values. For example, if a user has set up different default dimensions for two accounts used on a journal line, different dimension values might be recommended, causing a conflict. Users can set default dimension priorities that will resolve these potential conflicts. In cases where conflicting default dimension values are of the same account type, the last entered account is favored.
You can access all the dimension information relating to a specific entry, improving traceability and inquiry response. When a journal or document containing global dimension information is posted, the dimension information is stored in two areas:
Directly in ledger entries
In a separate table
Shortcut dimensions are stored in a separate table, not in ledger entries.
The posted global dimensions and other dimensions are also recorded in a separate table, depending on whether they relate to a posted document or ledger entry.
Storing posted dimensions in a separate table allows for an unlimited number of dimensions. If dimensions are only recorded on the entries, for each new dimension created, a new field must be added to every table that contains the entries. This cannot be done without having a license with solution developer permissions.
Remember that all posted dimension values will be stored in this one table. Global dimensions are also available in the ledger entry tables.
Account Schedule analysis capabilities are primarily based on the G/L accounts and their structure in the Chart of Accounts. The analysis view is a means of viewing data from the general ledger for particular output needs based on criteria specified within a business. For an analysis view, G/L entries are grouped by criteria such as:
G/L accounts
Period
Business units
Up to four dimensions
In other words, if a G/L entry has been posted to a particular account with one of the four dimensions selected for an analysis view, this G/L entry information will be included in the analysis view as an analysis view entry. You can include detailed dimension information in an analysis view using the Analysis View Filter.
You can for example include G/L budget entries in an analysis view to compare actual figures with expectations. The analysis view can be continually updated with new G/L entries using the following methods:
Clicking Update on a specific Analysis View Card
Running the Update Analysis Views batch job
Placing a check mark in the Update on posting check box on the Analysis View Card
Use the analysis view in the Analysis by Dimensions page, where it is possible to:
Filter amounts
Manipulate the presentation of amounts
Compare actual amounts with budgeted amounts
Tip
Automatically updating an Analysis View each time a G/L entry is posted might create a performance issue. It is actually recommended to turn off automatic updates to prevent issues with performance.
Budget entries included in an analysis view can only be updated using the first two methods.
The Analysis View Card contains the criteria for creating the Analysis View entries for the Analysis by Dimensions page.
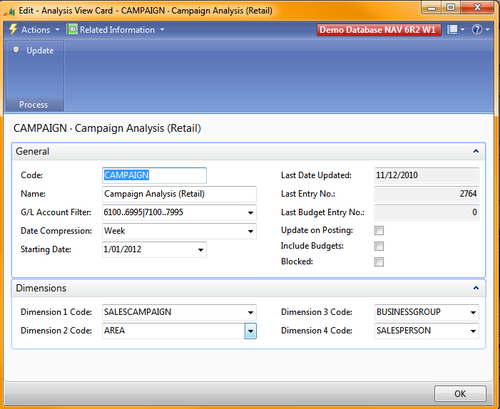
In the following table, there's a brief explanation of the fields in this window:
|
Field |
Description |
|---|---|
|
Code and Name |
A unique identifier and description of the analysis view. |
|
G/L Account Filter |
The G/L accounts that are included in an analysis view. Setting filters also specifies that only entries posted to the filter accounts are included when an analysis view is updated. |
|
Date Compression |
By using date compression, the level of detail for an analysis view is determined. For example, to analyse financial information for an analysis view on a monthly basis, use the Month date compression to sum all entries in a given month and create one single entry for the entire month. |
|
Starting Date |
All G/L entries posted on or after the entered Starting Date will be compressed to the level selected in the Date Compression field and included in the analysis view. The Posting Date for the compressed entries will be the first date of the related period. For example, if compressing by month with a Starting Date of 1/1/10, the compressed entries for each month will have a Posting Date of 1/1/10, 2/1/10, 3/1/10, and so on. All entries prior to the Starting Date are compressed into one entry for each G/L account, for each dimension combination. The Posting Date of these prior entries is the day before the Starting Date. |
|
Last Date Updated |
Displays the date on which the analysis view was last updated. |
|
Last Entry No. |
Contains the number of the last G/L entry posted prior to when you update the analysis view. If G/L entries have been posted since the analysis view was last updated, the analysis view will not include these entries. |
|
Last Budget EntryNo. |
Contains the number of the last budget entry entered prior to when you update the analysis view. If additional budget entries have been entered since the analysis view was last updated, the analysis view will not be up-to-date. |
|
Update on Posting |
If selected, Microsoft Dynamics NAV automatically updates the analysis view every time an entry is posted. |
|
Include Budgets |
If selected, analysis view budget entries are included when updating an analysis view. Updating both analysis view entries and analysis view budget entries simultaneously ensures that up-to-date information is used in the comparison of actual and budgeted figures. |
|
Blocked |
If selected, the analysis view cannot be updated. Neither the Update on Posting function nor the Update Analysis View batch job can be used to update an analysis view while it is blocked. |
|
Code and Name |
A unique identifier and description of the analysis view. |
The Dimensions Fast Tab contains the four dimensions that can be used as filters in the Analysis by Dimensions page. These dimensions provide the ability to investigate and monitor relationships between entries and the dimension information attached to them.
To create an analysis view, follow these steps:
In the navigation pane, click the Administration department.
Click Application Setup and then click Financial Management.
On the Financial Management page, click Dimensions, and then click Analysis Views.
Click New to insert an analysis view.
In the Code field, type a unique identifier for the analysis view.
In the Name field, type a short description.
In the G/L Account Filter field, enter the accounts to be included in the analysis view.
If compressing analysis view entries, do the following:
In the Date Compression field, enter the period to use
In the Starting Date field, enter the date on or after which posted entries will be compressed
Select the Include Budgets check box to update budget entries when the analysis view is updated.
Expand the Dimensions Fast Tab.
Enter the dimensions to be included in the analysis view.
Tip
Attention
If an analysis view is deleted, Microsoft Dynamics NAV deletes all associated analysis view entries.
You can further filter the G/L entries used to make the Analysis View entries using dimension value filters. Setting a dimension value filter establishes that only entries with the dimension values set in the filter are to be included in an analysis view.
For example, an analysis view is set up for the purposes of analysing the sales activity of particular departments. The Analysis View Filter is then used to specify that only entries with the company-defined dimension called Department and with the specified dimension values can be included in that analysis view.
To add dimension value filters, follow these steps:
On the Analysis View Card page, click the Related Information menu, go to Analysis, and then click Filter.
In the Dimension Code field, enter the dimension to filter.
In the Dimension Value Filter field, enter the dimension value to be included in the analysis view.
Repeat steps 2-3 for additional dimension value filters.
Click OK to close the Analysis View Filter page.
In the Action Pane, click Update.
Click Yes to update the Analysis View.
Click OK to close the Analysis View Card page.
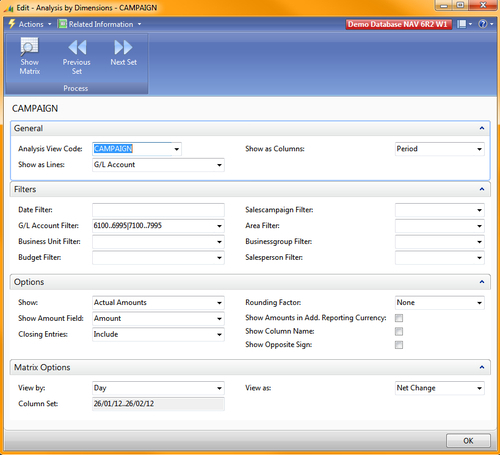
In the Analysis by Dimensions Matrix page, you can view and analyse amounts derived from analysis views that they have created. You can analyse entries from various perspectives by selecting dimensions on each axis in the matrix. Entries can also be filtered to create a highly specific picture of a company's activities.
You can access the Analysis by Dimensions page on the General Ledger page by clicking Analysis by Dimensions under Analysis & Reporting, selecting the relevant analysis view, and clicking Edit Analysis Update.
It is not possible to print an analysis view directly from the Analysis by Dimensions page. However, dimension information can be printed by combining analysis view entries with Account Schedule column layouts in the reports called Dimensions—Total and Dimensions—Detail.
Analysis views can be exported to Excel. When running an analysis view, you can use the menu at the top of the window, as you can see in the next screenshot:
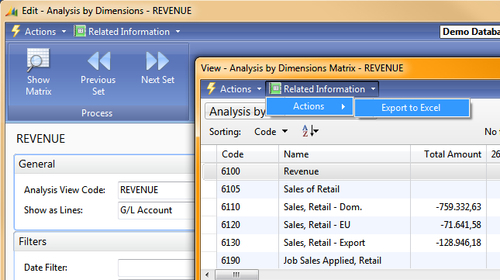
Doing this exports the data into Excel and from there you can print it or use it for further analysis.