
Charts are a very big part of the new dashboard features in Microsoft Dynamics CRM 2011, and one of the best features of the new chart module is the ability to drill into segments of the chart data. By drilldown, we mean the ability to filter the data and focus on a particular segment of the records being used to build the chart as a whole.
Carry out the following steps in order to complete this recipe:
Select the Microsoft Dynamics CRM Overview dashboard from the list of available dashboards.
Locate the Sales Pipeline chart, and enlarge the chart to make it easier to work with (see the Enlarging a chart to full screen recipe at the beginning of this chapter):
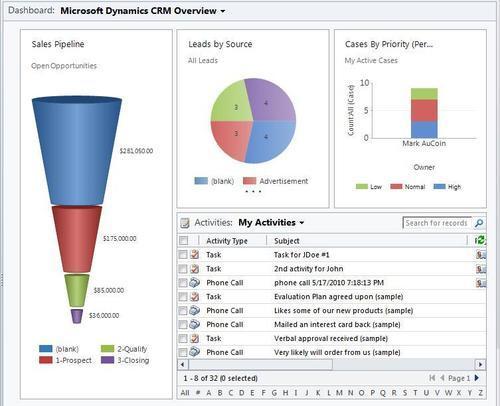
Click on one of the segments in the funnel chart. I would suggest the segment shown in red named 1-Prospect as we know it has some good sample data. You will see a small pop-up menu appear, as shown in the following screenshot...