
When your application is in production, one of the major tasks is to make sure that your applications are running as expected. You can verify this by monitoring the throughput and the latency of the events being processed by your applications.
In the Visualizer, first select the application and the stage that you wish to monitor in the Domain Browser window. For example, let's select helloworldAdapter. Next, click on the Create Diagnostics button, which is shown in the following screenshot:
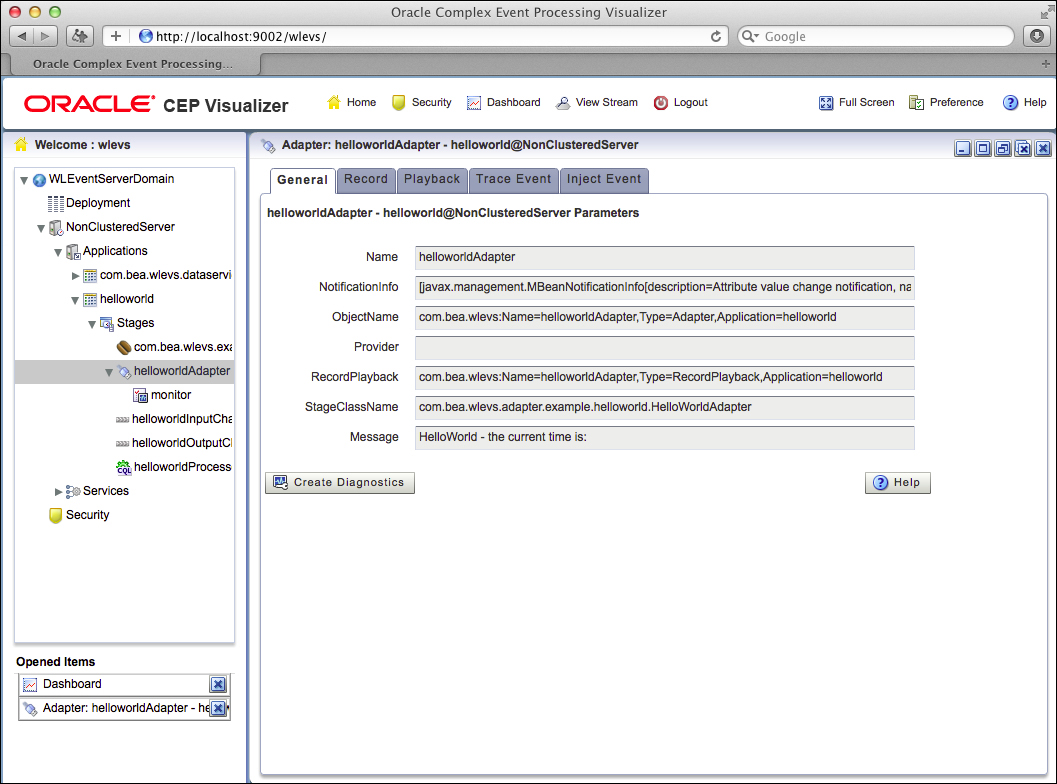
When you do this, a new panel with three sections named Profile Information, Latency, and Throughput shows up. In the Profile Information section, you need to give your monitoring profile a name, and optionally set the State option to On. Keep in mind that a profile can monitor both latency and throughput. Next, we show how to monitor latency:
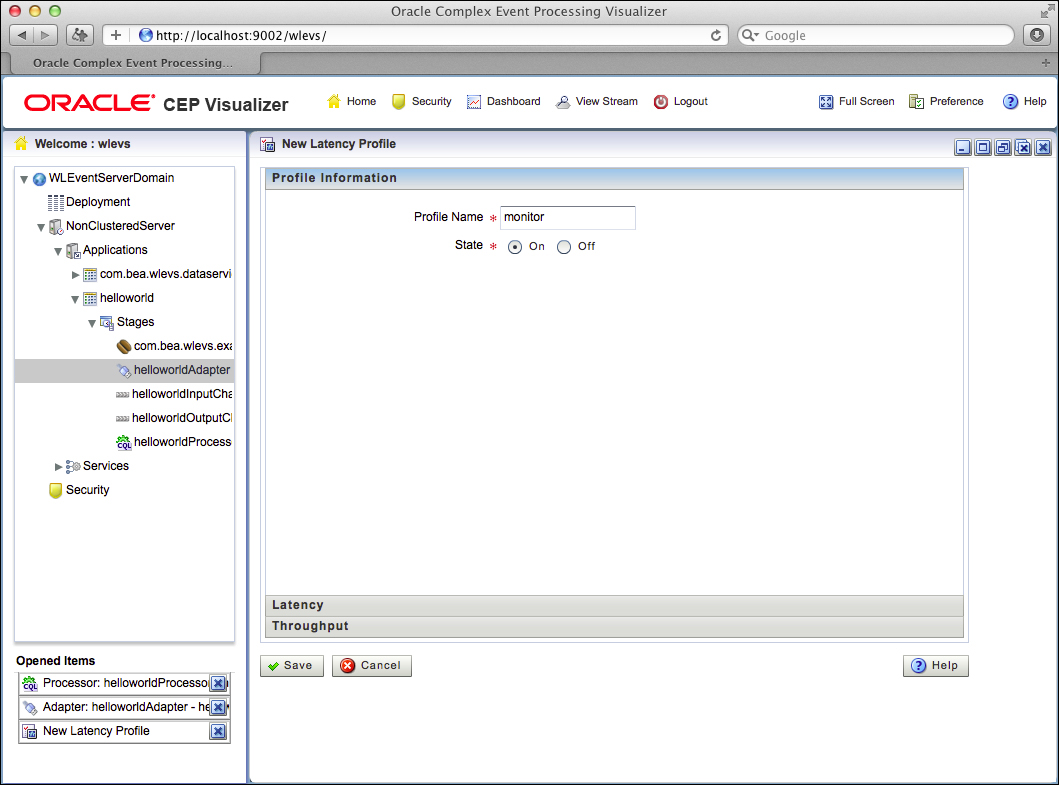
Next, select the Latency section. In this section, you can enable the monitoring of the latency of the events that flow through the EPN. The latency...