
It is sometimes necessary to debug a process that is already running. This is necessary when building a Windows service or an application that cannot have a user interface or an entry point assigned to it. The debugging process helps the IDE to debug a running process from inside the IDE if the appropriate debug symbols are there within the IDE.
To debug a running process, you need to first run the program. You can either run the program on the current machine by going to the bin folder of the project and double-clicking on the .exe file, or you can host it in another computer on the network.
Let's now take a look at debugging an already deployed process in the following simple steps:
To debug a process, you need to open the exact code that built the project to create the process.
Once you open the code, go to Debug | Attach to Process, where an IDE window will pop up, as shown in the following screenshot:
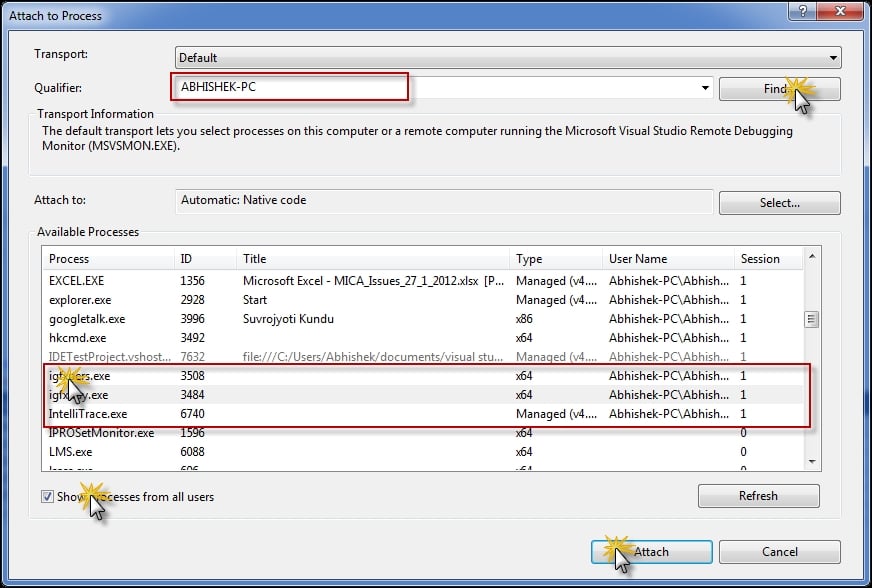
The Attach to Process dialog box allows you to either select a process from the list on your machine, or select a process running on the remote machine by either choosing the PC using the Browse button in the Qualifier or typing the IP address of the machine.
Once you select the machine, choose the process that you want to debug.
You can choose Show process from all users or Show process from all sessions to get a list of processes that are run by other users in other sessions too.
Once you find the process that you want to debug, select it and click on Attach.
If everything is fine, the process will get attached with the source code.
To clarify how the Attach to Process feature works, you need to first understand how the debugger works inside Visual Studio. Visual Studio Debugger is a module running inside Visual Studio, which can inspect each IL instruction that is being executed by the process and matches the source code in the project. This mapping is done using a special file that holds information of each and every instruction, the file info, its checksum, and so on, called the PDB file. When the process gets executed, the actual mapping instruction set is also read from the PDB file by the debugger, and when it finds any halt or break or even an exception in the process, it automatically pauses the process inside Visual Studio and opens the source code corresponding to the IL statement just encountered. Visual Studio Debugger is also capable of displaying the local information and other related debugging information in the exact source code line.
In the case of remote debugging, one must run the Remote Debugging Monitor called MSVSMon.exe on the same machine where the remote process is running. This file comes free with your Visual Studio installation and you can run it directly from the Visual Studio command prompt. The remote debugging needs an exception of MSVSMon against the firewall.
Note
To debug a process, it can be deployed in the debug mode; otherwise, the release mode process can also be attached with reduced debugging functionalities.
You must also run as an administrator or the same user who is running the process. Sometimes, it can ask for the user ID and password when logging in to a remote machine.
Working with a debugger for a running process is very interesting and useful. Let's look at some of the other interesting debugging techniques that you might apply to improve the debugging experiences of a program.
For users who want to debug by writing, the .NET class library opens up some interesting debugger APIs that you can invoke from your source code to call the debugger manually.
From the very beginning, there is a DEBUG preprocessor variable that determines whether the project is built in the debug mode.
You can write the following:
#IF DEBUG
/// The code runs only in debug mode
#ENDIF
The preprocessor directives are actually evaluated during compile time, which means the code inside #IF DEBUG will only be compiled in the assembly when the symbol is included.
There are other options such as Debug.Assert, Debug.Fail, Debug.Print, and so on. All of them only work in the debug mode. In the release mode, these APIs won't get compiled.
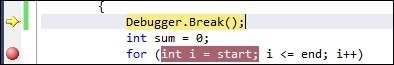
You can also call the debugger attached with the process, if any, using Debugger.Break(), which will break the debugger in the current line. You can check Debugger.IsAttached to find whether the debugger is attached to the current process, as shown in the following screenshot:
We can also load and attach a process directly to the debugger using code by referencing the EnvDTE packages. We will discuss them later in this book.
Note
When you start debugging your code, Visual Studio launches the actual process and one in .vshost in its filename. Visual Studio enhances the experience of debugging by enabling partial trust debugging and improved F5 experience using the vshost file. These files act specially in the background to attach the actual process with predefined AppDomain to experience flawless debugging. The .vshost files are solely used by the IDE and shouldn't be shipped in an actual project.
Visual Studio needs Terminal Services to run inside Visual Studio as it communicates with the process even when it is in the same machine using Terminal Services to maintain a seamless experience on both the normal and remote debugging of a process.