Book Image

Agile Project Management with GreenHopper 6 Blueprints

By : Jaibeer Malik
Book Image

Agile Project Management with GreenHopper 6 Blueprints

By: Jaibeer Malik

Overview of this book

Agile methodologies like Scrum focus on customer values in an incremental way. Regular planning, tracking, reporting, and improving can become equally challenging from a project management perspective. GreenHopper is a tooling support for JIRA that offers easy adoption of agile practices through rich interfaces for effective team collaboration and project management. Agile Project Management with GreenHopper 6 Blueprints is a step-by-step guide that teaches you how to manage agile projects using the GreenHopper tooling system. With easy adoption using pre-sets for Scrum & Kanban, the rich interface focuses on the work at hand, increasing team productivity. Executing sprints, tracking sprints, and reporting on agile projects has never been so easy. The integration with different development environments helps teams to focus on collaboration, communication, and continuous improvement. This book covers agile project management concepts using GreenHopper. You will learn about backlog management for your agile team, how to create projects and boards for your agile team, and how to create new backlog items, prioritize items, estimate backlog items, create sprints, and update technical task status and report on the same. You will learn everything you need to know about managing an agile project using GreenHopper and how to achieve the best value for your team.
Table of Contents (17 chapters)
Agile Project Management with GreenHopper 6 Blueprints
Credits
About the Author
About the Reviewer
www.PacktPub.com
Preface
Index

Working with a cumulative flow diagram


The cumulative flow diagram is a graphical representation of the issues in different flow states over a period of time. It represents the work accomplished over time. The Burndown chart is drawn for incremental backlog over the span of a Sprint and the cumulative flow diagram is plotted over the span of a release cycle.

To access the cumulative flow diagram, go to your team board, click on the Report link and select Cumulative Flow Diagram.

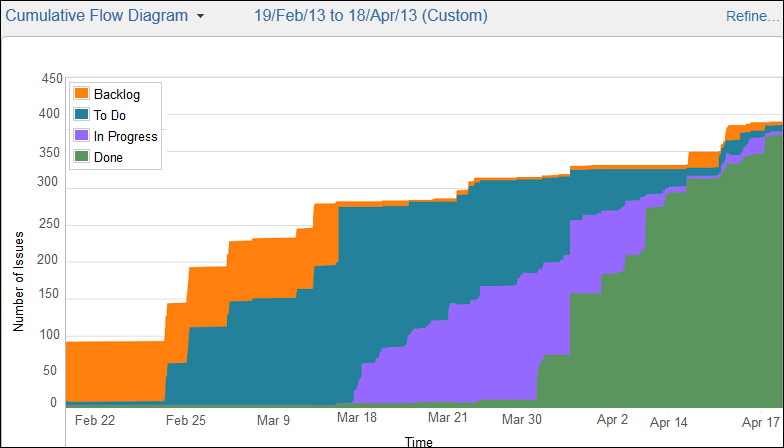
As shown in the preceding screenshot, the cumulative flow diagram is plotted displaying the initial "to do" backlog items and how the work is accomplished over time.

The cumulative flow diagram clearly shows the work which still needs to be done, the work in progress,, and completed work over time.

You can select Report timeframe for the diagram by selecting a specific date range as shown in preceding screenshot. You can also use the refine functionality to filter the data further.