

In our application we would also like to have an overview of all employees in the company. We can get this overview by creating a report. There are several types of reports and we just start with a simple report based on a query.
In the Application Builder, go to the application we just created and click on the Create Page button.
In the Page Type dialog, select Report.
A page is shown where we can choose between the different types of reports. Options are: interactive reports, classic reports, reports based on a web service result, and wizard reports. We will choose classic reports.
Some of the other types of reports will be covered in other recipes in this book. The next recipe is on interactive reports. In Chapter 8, Using Web Services, some examples of building reports on web services are explained. The Wizard Report option is not explained separately, because it just offers an easier, step-by-step way of building a report.
In the next step you can assign a page number and a page name to the report. Furthermore, you can indicate whether you would like to have breadcrumbs on your report page. Leave the Breadcrumb option to Do not use breadcrumbs on page and click on Next.
In this step you can choose to include tabs in your report page. We leave it to Do not use tabs. Click on Next.
In this step you must enter a query in the textarea. You can use the Query Builder to help you build your query or you can also enter it manually. We use the following query:
select *
  from emp
After you have entered the query, click on Next.
In the next step, you can define a report template, the region name, a number of rows displayed per page, and whether the user should be able to print the report on paper or spool it to a comma-separated file. Leave the options as they are and click on Next.
In the last step, you see the confirmation page. If the choices made are not satisfactory, click on the Previous button to go back and modify the options. Otherwise, click on the Finish button.
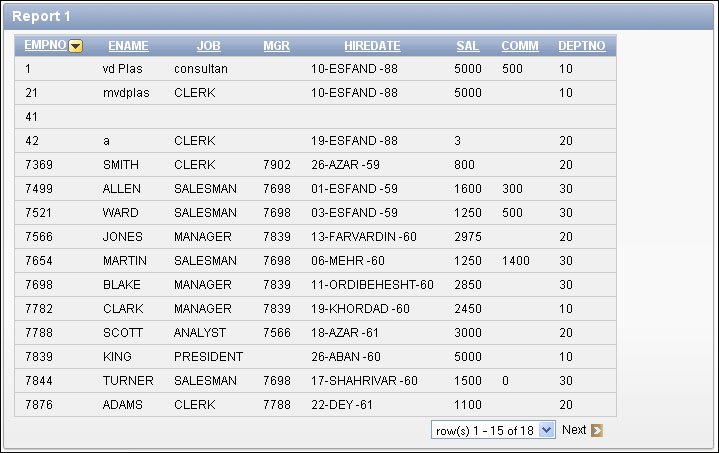
The report is ready now. You can edit the report to define the settings or you can run the report to see how it looks. The result should be something like the following:
When you look at the page in the Application Builder, you will see that APEX created a Reports region.
Right-click on the region name of the report and click on Edit to see the details of the report.
In the Region source you can see the query you just entered. If you want to see the column details, click on the Report Attributes tab:

Here you can modify the column heading, the heading alignment, or the names of the columns. To get more into details about a column you can click on the pencil icon next to the column name.
Sometimes in a project, the business case for a report changes. Instead of a classic report, the customer would like an interactive report. In case there are two options, remove the Current Report region and create a new one based on an interactive report or just migrate the current report using built-in functionalities.
When we are looking at the Region Definition tab of the Edit Region page, we can see a Tasks list on the right-hand side of the screen. One of the options is Migrate to Interactive Report. This migration is not a Holy Grail, but can save a lot of time in the migration process.
In the following page, enter
EMPNOin the Unique Column field and click on the Migrate button to see what happens.
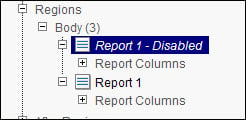
In the tree view of the page, we can see that the old Report region still exists but it's labeled Disabled. The new interactive report is added as we can see it in the following screenshot:
More on interactive reports is explained in the following recipe.
Chapter 8, Using Web Services explains (among many other things) how to create a report on web service references.