In many reports it's required to show some (or all) of the figures in charts. This will give users the opportunity to quickly see the data and possibly take actions accordingly.
This recipe will show how to create a chart and some possibilities to configure them.
In the earlier recipes, we created the regions while building a new page. Of course, it's also possible to add regions on existing pages. To do so in this example, first prepare an empty page which will hold the region with the chart.
Create a new region by right-clicking on the Regions label and choose Create.
Select Chart and click on Next.
Choose Flash chart and click on Next.
Select Pie & Doughnut and click on Next.
Select 3D Pie and click on Next.
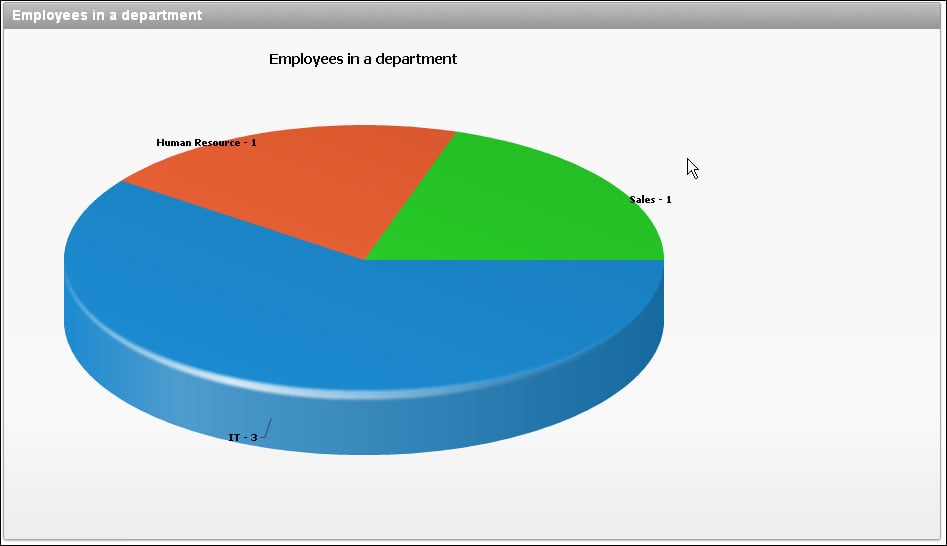
Enter Employees in a department in the title, leave the other fields with the default values and click on Next.
Enter Employees in a department in the Chart title, leave the other fields the default values and click on Next.
We are going to select all employees per department, so we will enter a query that will get us that data into the chart.
Enter the following query into the SQL Query field:
select null link
     , dept.name label
     , COUNT(emp.ID) value1
  from APP_EMPLOYEES emp
     , APP_DEPARTMENTS dept
 where emp.dept_id = dept.id
 group by dept.name
[9672_01_04.txt]
Click on Create Region.
Run the page.
The page shows a graphical representation of the number of employees in each department:
There are a number of possibilities to change and enhance this chart. Besides the 3D pie we have created here, there are dozens of other chart types. But there is a catch. Once a chart is created, the number of types it can be changed to is limited. When we would like to use a completely different chart type, the chart region has to be re-created.
This recipe can be easily expanded with a link to another page which can be clicked inside the chart.
To do this, first navigate to the Chart Series by expanding the tree view under the Chart region or by clicking on the edit link in the chart properties page. Edit the query on which the chart is based and change the first column. If we, for example, would have a page with ID 888, a query with a link to that page would look like the following:
select 'f?p=&APP_ID.:888:&APP_SESSION.::NO::P888_DEPT_ID:'||dept.id link
     , dept.name label
     , COUNT(emp.ID) value1
  from APP_EMPLOYEES emp
     , APP_DEPARTMENTS dept
 where emp.dept_id = dept.id
 group by dept.name, dept.id
[9672_01_05.txt]
We have chosen to show a dynamically generated link here. A few of the parameters need an explanation:
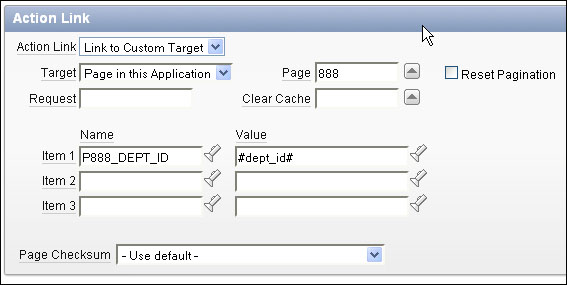
It is also possible to create a link by altering the Action Link region on the Chart Series page. The same items will be filled by this process, but it is easier to use when it is a relatively simple application: