Book Image

Qlikview for Finance

Book Image

Qlikview for Finance

Overview of this book

This book is an effective step-by-step tutoring guide for financial analysis using Qlikview. It begins by teaching you the crucial concepts of Qlikview Finance to help you develop an effective understanding of financial data analysis and finance. The book then goes on to cover real-world, practical examples on the use of Qlikview for financial planning and analysis, expense management, risk management, and more. Moving on, topics such as Asset Management QlikView Dashboard and Retail Sales Analysis are covered in a strategic way. We then shift the focus to deal with the concepts of Inventory, Supply Chain, and Plant Coverage Dashboards. The book then reaches its conclusion by dealing with ways to share your QlikView insights. By the end of this book, you will have a good understanding of how to use Qlikview for numerous applications in finance.
Table of Contents (18 chapters)
QlikView for Finance
Credits
Disclaimer
About the Author
About the Reviewers
www.PacktPub.com
Preface
Index

The nuts and bolts of the CFO dashboard expenses tab


First we are going to get the pie chart out of our way without deleting the object from the sheet.

Minimizing the pie chart

Right-click on the pie chart and bring up its Properties. Navigate to the Caption tab on the right. You may need to use the left < > right arrows to see it.

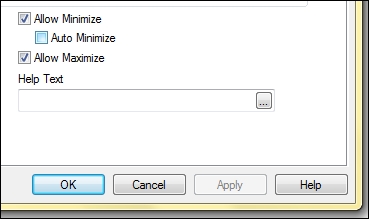
Figure 9-2: Caption tab: Allow Minimize and Allow Maximize checkboxes

Under the Caption tab, you will see the Allow Minimize and Allow Maximize checkboxes on the bottom-right corner. Check them both, click Apply, and close the wizard. Now you will see the standard computer display symbols for minimizing a window.

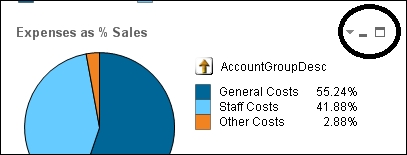
Figure 9-3: Minimize and maximize symbols now appear

Click the - symbol to minimize the pie chart and make room to spread out the line chart. Click on the words in the minimized box, and the pie chart will maximize. From the maximized chart, you can choose the - symbol again to minimize. You can also use the double-boxes symbol to restore the pie chart...