
Xcode and Swift come with a powerful memory debugging infrastructure, letting you inspect the contents of existing and destroyed objects, inspect the contents and relationships between your objects, and more. In this section, we'll get you started with these powerful tools, so that later on, you'll be able to debug complicated pieces of code with ease.
In order to see the memory allocation backtraces, we need to enable Malloc Stack in our Scheme. You can do so by following these steps:
- Open your
Schemesettings with ⌘ | <, or by navigating toProduct|Scheme|Edit Scheme... - Navigate to the
Diagnosticstab
- Ensure that you select the options shown in the following screenshot:
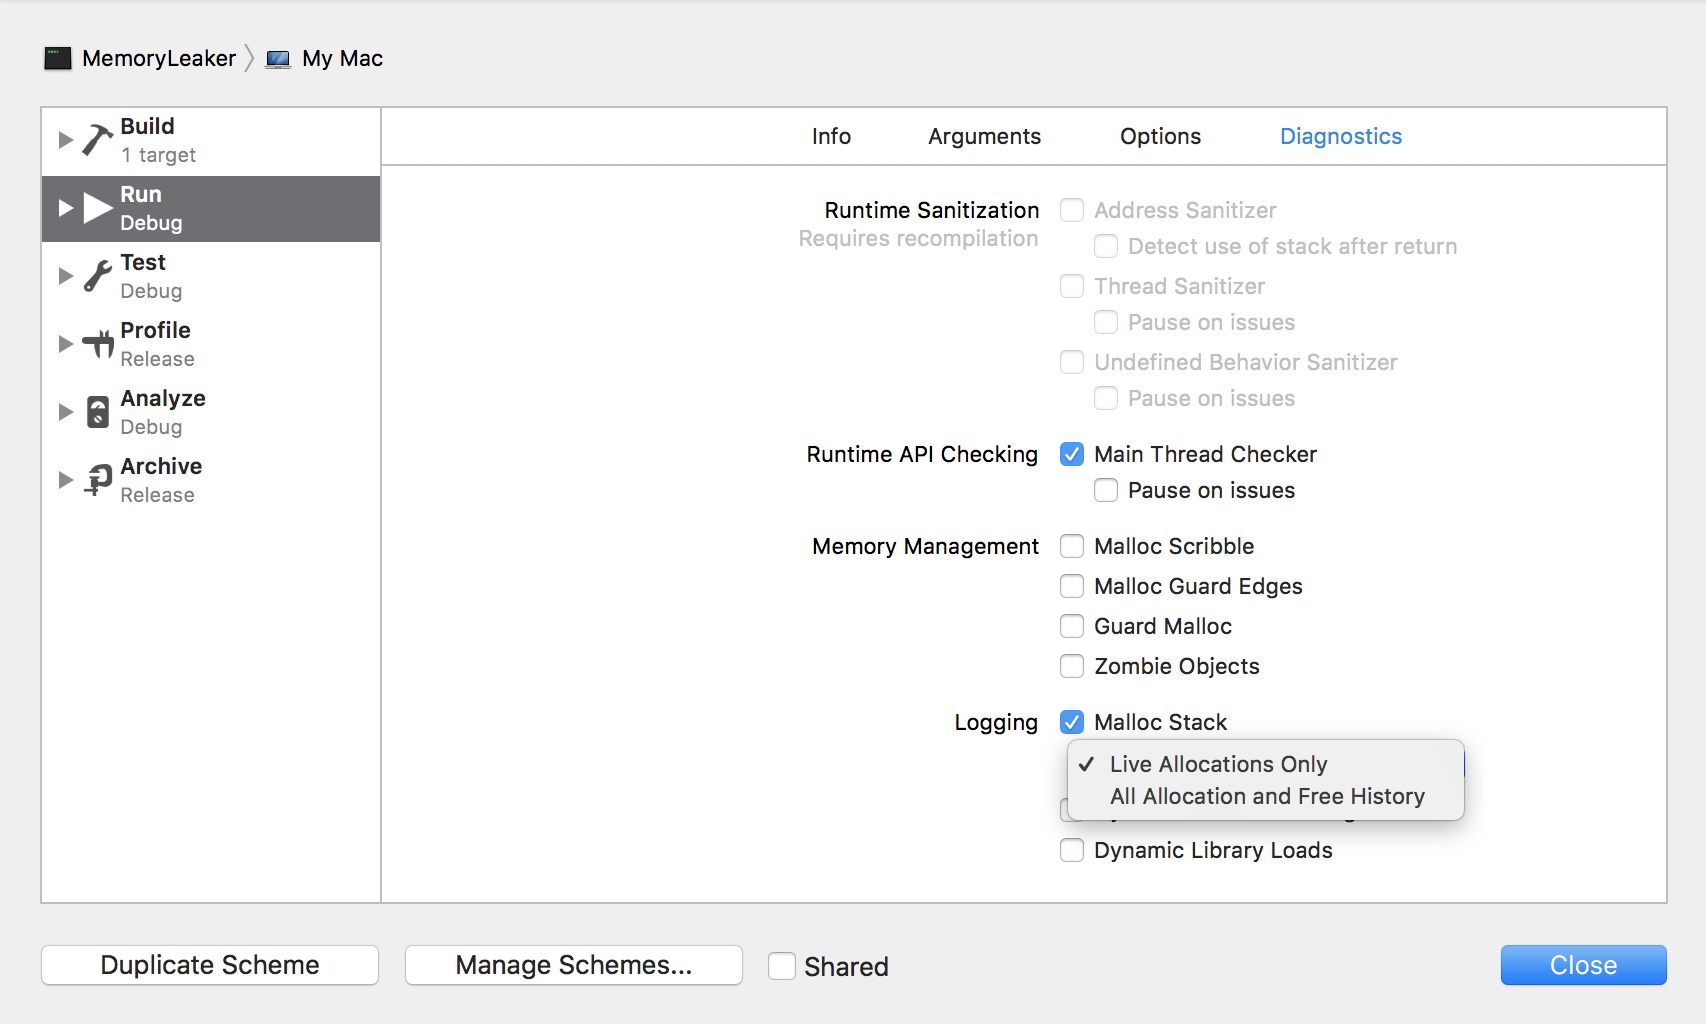
With this configuration on your Scheme, you can run your project again, and we'll be able to debug memory issues in depth, right into Xcode.