
Typical applications in today's world are built with multi-tiered architecture; to manage such applications a system administrator has to navigate through multiple management tools and consoles that come along with each product. Some of the tools have a browser interface, some have a thick client interface, or even a command line interface. Navigating through multiple management tools often involves doing some actions from a browser or running some scripts or launching a thick client from the command line.
For example, to find bottlenecks in a J2EE application in the production environment, an administrator has to navigate through the management console for the HTTP server, the management console for the J2EE container, and the management console for the database.
Enterprise Manager Grid Control is a systems management product for the monitoring and management of all of the products in the data center. For the scenario explained above, Enterprise Manager provides a common management interface to manage an HTTP server, J2EE server and database. Enterprise Manager provides this unified solution for all products in a data center.
In addition to basic monitoring, Enterprise Manager provides a unified interface for many other administration tasks like patching, configuration compliance, backup-recovery, and so on.
Some key features of Enterprise Manager are explained here.
Enterprise Manager provides a comprehensive view of the data center, where an administrator can see all of the applications, servers, databases, network devices, storage devices, and so on, along with performance and configuration data. As the number of all such resources is very high, this Enterprise Manager highlights the resources that need immediate attention or that may need attention in near future. For example, a critical security patch is available that needs to be applied on some Fusion Middleware servers, or a server that has 90% CPU utilization.
The following figure shows one such view of a data center, where users can see all entities that are monitored, that are up, that are down, that have performance alerts, that have configuration violations and so on. The user can drill down to fine-grained views from this top-level view.
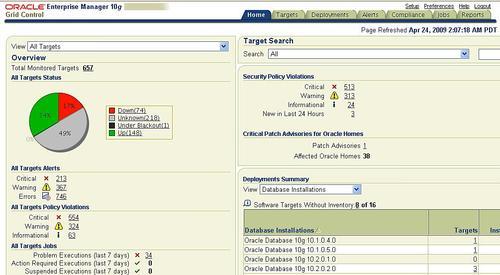
The data in the top-level view and the fine-grained drill-down view can be broadly summarized in the following categories:
Data that shows how an IT resource is performing, that includes the current status, overall availability over a period of time, and other performance indicators that are specific to the resource like the average response time for a J2EE server. Any violation of acceptable performance thresholds is highlighted in this view.
Configuration data is the configuration parameters or, configuration files captured from an IT resource. Besides the current configuration, changes in configuration are also tracked and available from Enterprise Manager. Any violation of configuration conformance is also available. For example, if a data center policy mandates that only port 80 should be open on all servers, Enterprise Manager captures any violation of that policy.
In any data center there are some scheduled operations, these operations could be something like a system administration task such as taking a backup of a database server or some batch process that moves data across systems, for example, moving orders from fulfillment to shipping. Enterprise Manager provides a consolidated view of the status of all such scheduled operations.
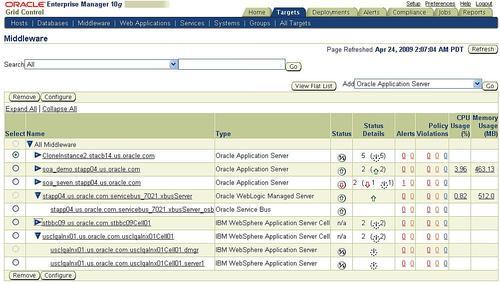
Enterprise Manager provides a listing of all hardware and software resources with details like version numbers. All of these resources are also categorized in different buckets - for example, Oracle Application Server, WebLogic application Server, WebSphere application are all categorized in the middleware bucket. This categorization helps the user to find resources of the same or similar type. Enterprise Manager. It also captures the finer details of software resources — like patches applied.
The following figure shows one such view where the user can see all middleware entities like Oracle WebLogic Server, IBM WebSphere Server, Oracle Application Server, and so on.
Enterprise Manager monitors IT resources around the clock and it gathers all performance indicators at every fixed interval. Whenever a performance indicator goes beyond the defined acceptable limit, Enterprise Manager records that occurrence. For example, if the acceptable limit of CPU utilization for a server is 70%, then whenever CPU utilization of the server goes above 70% then that occurrence is recorded. Enterprise Manager can also send notification of any such occurrence through common notification mechanisms like email, pager, SNMP trap, and so on.
All of the performance indicators captured by Enterprise Manager are saved in the repository. Enterprise Manager provides some useful views of the data using the system administrator that can analyze data over a period of time. Besides the fine-grained data that is collected at every fixed interval, it also provides coarse views by rolling up the data every hour and every 24 hours.
Enterprise Manager gathers configuration data for IT resources at regular intervals and checks for any configuration compliance violation. Any such violation is captured and can be sent out as a notification. Enterprise Manager comes with many out-of-the-box configuration compliance rules that represent best practices; in addition to that, system administrators can configure their own rules.
All of the configuration data is also saved in the Enterprise Manager repository. Using data, the system administrator can compare the configuration of two similar IT resources or compare the configuration of the same IT resource at two different points in time. The system administrator can also see the configuration change history.
Most of the more recent applications are built with multi-tiered architecture and each tier may run on different IT resources. For example, an order booking application can have all of its presentation and business logic running on a J2EE server, all business data persisted in a database, all authentication and authorization performed through an LDAP server, and all of the traffic to the application routed through an HTTP server.
To monitor such applications, all of the underlying resources need to be monitored. Enterprise Manager provides support for grouping such related IT resources. Using this support, the system administrator can monitor all related resources as one entity and all performance indicators for all related entities can be monitored from one interface.
Enterprise Manager provides necessary constructs and interfaces for managing service level agreements that are based on the performance of IT resources. Using these constructs, the user can define indicators to measure service levels and expected service levels. For example, a service representing a web application can have the same average JSP response time as a service indicator, the expected service level for this service is to have the service indicator below three seconds for 90% of the time during business hours.
Enterprise Manager keeps track of all such indicators and violations in the context of a service and at any time the user can see the status of such service level agreements over a defined time period.
Many data center operations are repeated at fixed interval and on multiple IT resources. For example, database backup is performed every day at midnight for all of the database servers in a data center. Typically, system administrators write some scripts and use some scheduling mechanism like crontabs to perform these operations. Monitoring of such operations across multiple servers is expensive; the system administrator needs to check logs on each server and maintain scripts on each server and so on.
Enterprise Manager also provides a scheduling mechanism and, using that mechanism, the user can execute an operation on multiple resources as per the defined schedule. The outcome of all such operations, across multiple resources, is saved in the Enterprise Manager repository and the system administrator can see all of the results from one central console. Besides that, events like the success or failure of an operation can be sent out as notifications via standard notification mechanisms like email, SNMP trap, and so on.
Initial provisioning of new IT resources is an expensive operation; the system administrator needs to install the Operating System, all required software like the database, J2EE server, all required patches, and the business applications. After this, the system administrator needs to configure the software and applications. Enterprise Manager provides support for building gold images from existing IT resources, and provisioning new IT resources from the gold image. Using the gold image, the system administrator can easily provision a new IT resource by cloning it from an existing IT resource.
Enterprise Manager also provides a software library where the gold images of Operating Systems, software, and so on, can be stored for future use.
System administrators do need to publish data related to their data center; like resource utilization data, configuration compliance data, inventory of resources, and so on. Also, a lot of the data publishing activity has to be repeated at every fixed interval, for example, resource utilization data needs to be published at the end of every month.
Enterprise Manager has a reporting and publishing framework to build and publish reports in HTML format that summarize the data available in the Enterprise Manager repository. Report generation can be scheduled and the generated reports are also saved in the repository. These reports can be automatically sent out by emails as per the schedule defined by the system administrators.
There are many useful out-of-the-box reports that the system administrator can use to publish performance data, configuration compliance data, and so on. System administrators can also customize or build new reports through the intuitive user interface.
There are times when all of the performance indicators are within acceptable ranges, but users still complain for about application performance. To troubleshoot such issues, system administrators often log in to the application to try to simulate what the real users do. Sometimes such problems are related to some specific geographic regions only, for example, customers in Europe cannot check out the shopping cart but customers in other countries are fine.
Recording typical user actions and repeating those instructions from different geographical regions can provide proactive monitoring for such issues. Enterprise Manager provides a framework for such support where typical user behavior can be recorded and repeated from various geographical locations. In the example above, Enterprise Manager can record the web transaction for checking out of the shopping cart and can repeat this synthetic transaction from various locations.
Web transactions can be used for checking availability for web applications. Enterprise Manager provides other mechanisms to check the availability of other resources like TNSPING to check the availability of a database.
Enterprise Manager has a multi-tiered architecture; with the presentation layer on a J2EE server and content that is presented in HTML format. The Enterprise Manager console can be accessed through a browser that the system administrator can access remotely. Enterprise Manager is certified for all major browsers like Internet Explorer, Firefox, Netscape, Mozilla, and so on.