Book Image

Learning RStudio for R Statistical Computing

Book Image

Learning RStudio for R Statistical Computing

Overview of this book

Data is coming at us faster, dirtier, and at an ever increasing rate. The necessity to handle many, complex statistical analysis projects is hitting statisticians and analysts across the globe. This book will show you how to deal with it like never before, thus providing an edge and improving productivity. "Learning RStudio for R Statistical Computing" will teach you how to quickly and efficiently create and manage statistical analysis projects, import data, develop R scripts, and generate reports and graphics. R developers will learn about package development, coding principles, and version control with RStudio. This book will help you to learn and understand RStudio features to effectively perform statistical analysis and reporting, code editing, and R development. The book starts with a quick introduction where you will learn to load data, perform simple analysis, plot a graph, and generate automatic reports. You will then be able to explore the available features for effective coding, graphical analysis, R project management, report generation, and even project management. "Learning RStudio for R Statistical Computing" is stuffed with feature-rich and easy-to-understand examples, through step-by-step instructions helping you to quickly master the most popular IDE for R development.
Table of Contents (13 chapters)

Chapter 5. Generating Reports

In this chapter, we treat three different ways to produce reports that automatically include the results of an analysis.

A very important feature of reproducible science is generating reports. The main idea of automatic report generation is that the results of analyses are not manually copied to the report. Instead, both the R code and the report's text are combined in one or more plain text files. The report is generated by a tool that executes the chunks of code, captures the results (including figures), and generates the report by weaving the report's text and results together. To achieve this, you need to learn a few special commands, called markup specifiers, that tell the report generator which part of your text is R code, and which parts you want in special typesetting such as boldface or italic. There are several markup languages to do this, but the following is a minimal example using the Markdown language:

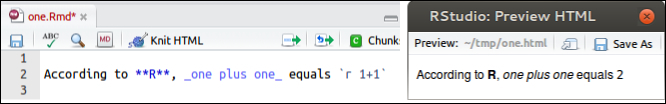
A simple example with Markdown

The left panel...