
Sometimes we don't want to graph data directly, but instead, plot the values of a function over a given domain. In this recipe, we'll see how to graph an inverse log function.
We'll use the same dependencies in our project.clj file as we did in the Creating scatter plots with Incanter recipe.
We'll use the following set of imports in our script or REPL:
(require '[incanter.core :as i]
'[incanter.charts :as c])We just create and display a function-plot object.
(def f-plot
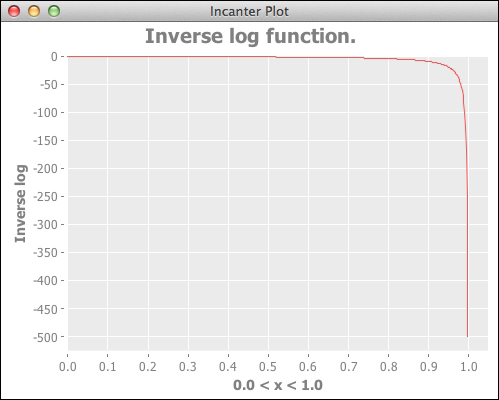
(c/function-plot
#(/ 1.0 (Math/log %)) 0.0 1.0
:title "Inverse log function."
:y-label "Inverse log"))
(i/view f-plot)The graph is as we would expect: