

In this recipe, in the pulse dataset, we will look at the proportion of students who smoke regularly. We want to check if the proportion is different now from a historical figure of 25 percent of students who smoke regularly. Additionally, we will convert the numeric values in the Smokes column to text. This step is not necessary for the proportions test but can be useful to display the results.
Open the Pulse.mtw dataset from the Minitab Sample Data folder. The column Smokes has values of 1 and 2; 1 refers to those who smoke regularly and 2 refers to those who don't smoke regularly.
The following steps will recode the values in the smokes column to categories of Smokes and Does not Smoke before checking to see if the proportion of smokers is different from the historical proportion of 0.25:
Go to the Data menu, click on Code, and select Numeric to Text….
Enter the data shown in the following screenshot into the dialog box:
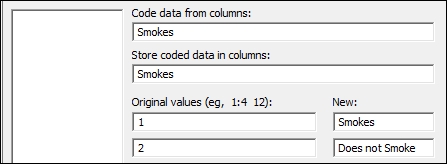
Click on OK.
Go...