

The regression tools in Minitab cover the very simple studies with a single predictor, fitted line plot, or the assistant regression tools, up to the very complex ones, such as nonlinear regression. This chapter starts with a fitted line plot and works through multiple regressions, logistic regression, and finally, nonlinear regression tools.
Minitab v17 has added new features to regression, compared to previous versions. The regression tools are now expanded to store fitted regression models in the response column. We can fit models for continuous data, binary, and poisson responses. Once a model has been analyzed, we can use it to predict responses, display contour plots of the response, find optimal values from the response optimizer, and more.
Majority of the steps in this chapter will take place in the Regression menu, which is found under the Stat menu, as shown in the following screenshot:
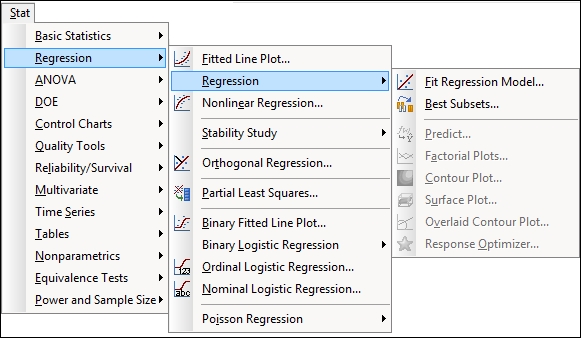
Similar to other menus, Regression is divided into subsections. The first group of...