

Creating an elevation profile is very helpful when trying to visualize a 3D terrain cross-section or simply to see the elevation gain of a bike tour. In this example, we will define our own LineString geometry and extract the elevation values from the DEMs that are located every 20 m along our line. The analysis will generate a new CSV file that we can open in Libre Office Calc or Microsoft Excel to visualize the new data as a line chart.
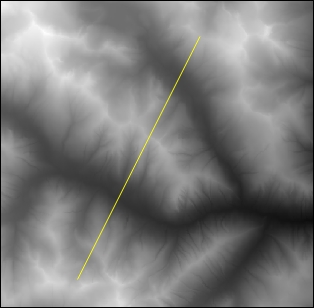
The 2D view of our line plotted on top of the elevation model as seen inside QGIS looks like this:
This recipe calls for GDAL and Shapely. Make sure that you have them installed and are running them inside your python virtual environment that you set up earlier. To visualize your final CSV file, you must also install Libre Office Calc or some other charting software. The code to execute this is located at /ch07/code/ch07-02_elev_profile.py.