Book Image

Learning Predictive Analytics with Python

By : Ashish Kumar, Gary Dougan
Book Image

Learning Predictive Analytics with Python

By: Ashish Kumar, Gary Dougan

Overview of this book

Social Media and the Internet of Things have resulted in an avalanche of data. Data is powerful but not in its raw form - It needs to be processed and modeled, and Python is one of the most robust tools out there to do so. It has an array of packages for predictive modeling and a suite of IDEs to choose from. Learning to predict who would win, lose, buy, lie, or die with Python is an indispensable skill set to have in this data age. This book is your guide to getting started with Predictive Analytics using Python. You will see how to process data and make predictive models from it. We balance both statistical and mathematical concepts, and implement them in Python using libraries such as pandas, scikit-learn, and numpy. You’ll start by getting an understanding of the basics of predictive modeling, then you will see how to cleanse your data of impurities and get it ready it for predictive modeling. You will also learn more about the best predictive modeling algorithms such as Linear Regression, Decision Trees, and Logistic Regression. Finally, you will see the best practices in predictive modeling, as well as the different applications of predictive modeling in the modern world.
Table of Contents (19 chapters)
Learning Predictive Analytics with Python
Credits
Foreword
About the Author
Acknowledgments
About the Reviewer
www.PacktPub.com
Preface
A List of Links
Index

Understanding the mathematics behind decision trees


The main goal in a decision tree algorithm is to identify a variable and classification on which one can give a more homogeneous distribution with reference to the target variable. The homogeneous distribution means that similar values of the target variable are grouped together so that a concrete decision can be made.

Homogeneity

In the preceding example, the first goal would be to find a parameter (out of four: Terrain, Rainfall, Groundwater, and Fertilizers) that results in a better homogeneous distribution of the target variable within those categories.

Without any parameter, the count of harvest type looks as follows:

Bumper

Moderate

Meagre

4

9

7

Let us calculate, for each parameter, how the split on that parameter affects the homogeneity of the target variable split:

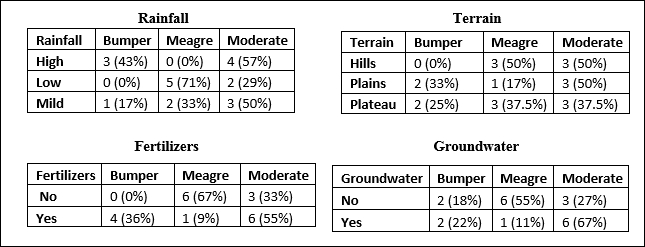
Fig. 8.4: Splitting the predictor and the target variables into categories to see their effect on the homogeneity of the dataset

If one...