

The plot() function is the workhorse of the matplotlib library. In this section, we will explore the line-plotting and formatting capabilities included in this function.
To make things a bit more concrete, let's consider the formula for logistic growth, as follows:
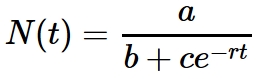
This model is frequently used to represent growth that shows an initial exponential phase, and then is eventually limited by some factor. The examples are the population in an environment with limited resources and new products and/or technological innovations, which initially attract a small and quickly growing market but eventually reach a saturation point.
A common strategy to understand a mathematical model is to investigate how it changes as the parameters defining it are modified. Let's say, we want to see what happens to the shape of the curve when the parameter b changes.
To be able to do what we want more efficiently, we are going to use a function factory. This way, we can quickly create logistic models...