Book Image

R Graphs Cookbook Second Edition

Book Image

R Graphs Cookbook Second Edition

Overview of this book

Table of Contents (22 chapters)
R Graphs Cookbook
Credits
About the Authors
About the Reviewers
www.PacktPub.com
Preface
Index

Creating graphs with maps


In this recipe, you will learn how to plot data on maps.

Getting ready

In order to plot maps in R, we need to install the maps library. Here's how to do it:

install.packages("maps")

When you run the preceding command, you will most likely be prompted by R to choose from a list of locations where you can download the library. For example, if you are based in the UK, you can choose either the UK (Bristol) or UK (London) options.

Once the library is installed, we must load it using the library() command:

library(maps)

Note

Note that we only need to install any package using install.packages() once but need to load it using library() or require() every time we restart a new session in R.

How to do it...

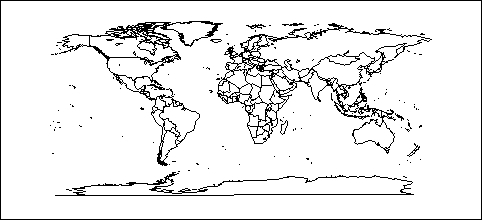
We can make a simple world map with just one command:

map()

Let's add color:

map('world', fill = TRUE,col=heat.colors(10))

How it works...

The maps library provides a way to project world data on to a low-resolution map. It is also possible to make detailed maps of the US. For example...