

In this recipe, we will learn how to fit a linear model and plot the linear regression line on a scatter plot.
All you need for the next recipe is to type it at the R prompt as we will only use some base functions. You can also save the recipe code as a script so that you can use it again later on.
Once again, let's use the mtcars dataset and draw a linear fit line for mpg versus disp:
plot(mtcars$mpg~mtcars$disp)
lmfit<-lm(mtcars$mpg~mtcars$disp)
abline(lmfit)
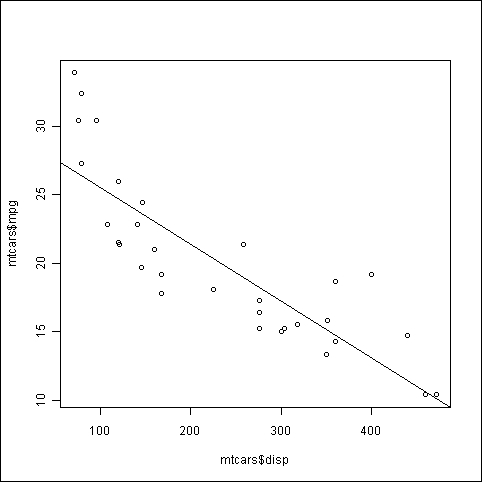
We first draw the basic scatter plot of mpg versus disp. Then, we fit a linear model to the data using the lm() function, which takes a formula in the form y~x as its argument. Finally, we pass the linear fit to the abline() function, which reads the intercept and slope saved in the lmfit object to draw a line.