In this recipe, we will learn how to make intuitive heat maps in a calendar format to summarize time series data.
In this recipe, we will use a custom function called calendarHeat() written by Paul Bleicher (released as open source under the GPL license). So, let's first load the source code of the function (available from the downloads area of the book's website):
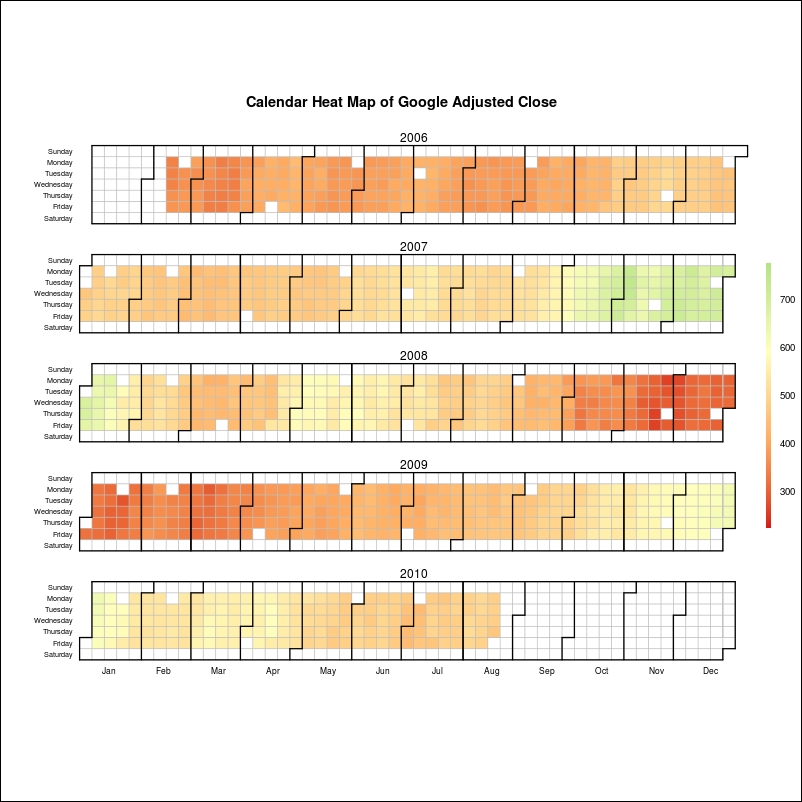
source("calendarHeat.R")We are going to use the google.csv example dataset, which contains stock price data for Google (ticker GOOG). Let's load it:
stock.data <- read.csv("google.csv")The calendarHeat() function also makes use of the chron library, which has to be installed and loaded using the following code:
install.packages("chron")
library("chron")