

We go a step further in this recipe and generate a pie chart where the labels are inside the pie rather than outside. I have used the plotrix package to construct a pie chart with legends and labels inside the pie. The previous pie chart is represented with labels as shown:
We must install the plotrix package for this recipe. Readers should refer to the recipe Installing Packages and Getting Help in R in Chapter 1, A Simple Guide to R.
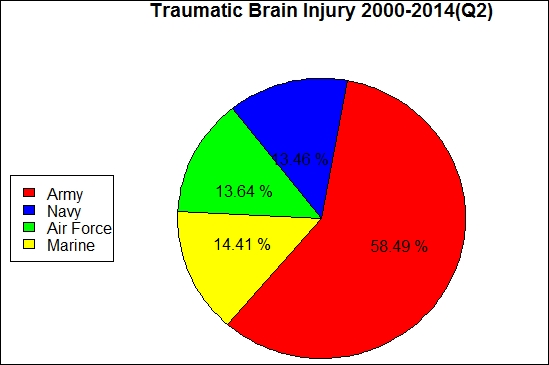
We have explored in detail, in the previous recipe, the method to generate labels for our plot using the paste() function. The following lines of code have not changed from our previous recipe:
data = c(179718,41370,41914,44280)
pct = (data/sum(data))*100
pct = round(pct,2)
labels = c("Army", "Navy", "Air Force","Marines")
labels1 = paste(pct, "%")
We will now create a blank plotting area using the generic plot() function. We include this step as we are required to specify the coordinates to construct...