

When computing the distribution of one variable (or a subset of variables), the main operation is the marginalization, which consists of summing over a variable (or a subset of variables) to eliminate it from the main expression. If we call ϕ a factor in the factorization of the joint distribution, we can use the following properties to generalize and improve the variable elimination algorithm we saw in the previous section:
- Commutativity:

- Associativity:
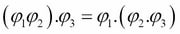
-
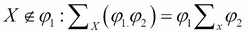
And if
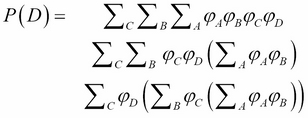
If again we apply it to the joint distribution P(ABCD) from the previous section, we again obtain:
In the end, the main expression that comes again and again is the sum-product over a factor, which can be written as  .
.
So in general, if we can find a good ordering of the factors or the variables in the case of a directed graphical model as we saw until now, we can, by applying the previous sum-product formula, eliminate step by step each variable until we obtain the desired subset.