

Let's take an example to understand conditional probability better. Let's say we have a bag containing three apples and five oranges, and we want to randomly take out fruits from the bag one at a time without replacing them. Also, the random variables  and
and  represent the outcomes in the first try and second try respectively. So, as there are three apples and five oranges in the bag initially,
 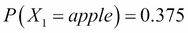 and
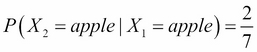
and 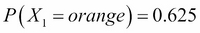 . Now, let's say that in our first attempt we got an orange. Now, we cannot simply represent the probability of getting an apple or orange in our second attempt. The probabilities in the second attempt will depend on the outcome of our first attempt and therefore, we use conditional probability to represent such cases. Now, in the second attempt, we will have the following probabilities that depend on the outcome of our first try:
 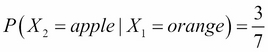 ,
, 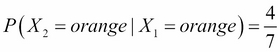 ,
,  , and
, and 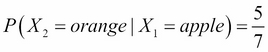 .
.
The Conditional Probability Distribution (CPD) of two variables and can be represented as  , representing the probability of given that is the probability of after the event has occurred and we know it's outcome. Similarly, we can have
  representing the probability of after having an observation for .
The simplest representation of CPD is tabular CPD. In a tabular CPD, we construct a table containing all the possible combinations of different states of the random variables and the probabilities corresponding to these states. Let's consider the earlier restaurant example.
Let's begin by representing the marginal distribution of the quality of food with Q. As we mentioned earlier, it can be categorized into three values {good, bad, average}. For example, P(Q) can be represented in the tabular form as follows:
|
Quality |
P(Q) |
|---|---|
|
Good |
0.3 |
|
Normal |
0.5 |
|
Bad |
0.2 |
Similarly, let's say P(L) is the probability distribution of the location of the restaurant. Its CPD can be represented as follows:
|
Location |
P(L) |
|---|---|
|
Good |
0.6 |
|
Bad |
0.4 |
As the cost of restaurant C depends on both the quality of food Q and its location L, we will be considering P(C | Q, L), which is the conditional distribution of C, given Q and L:
|
Location |
Good |
Bad | ||||
|---|---|---|---|---|---|---|
|
Quality |
Good |
Normal |
Bad |
Good |
Normal |
Bad |
|
Cost | ||||||
|
High |
0.8 |
0.6 |
0.1 |
0.6 |
0.6 |
0.05 |
|
Low |
0.2 |
0.4 |
0.9 |
0.4 |
0.4 |
0.95 |
Let's first see how to represent the tabular CPD using pgmpy for variables that have no conditional variables:
In [1]: from pgmpy.factors import TabularCPD

# For creating a TabularCPD object we need to pass three
# arguments: the variable name, its cardinality that is the number
# of states of the random variable and the probability value
# corresponding each state.
In [2]: quality = TabularCPD(variable='Quality',
                             variable_card=3,
                                values=[[0.3], [0.5], [0.2]])
In [3]: print(quality)
╒════════════════╤═════╕
│ ['Quality', 0] │ 0.3 │
├────────────────┼─────┤
│ ['Quality', 1] │ 0.5 │
├────────────────┼─────┤
│ ['Quality', 2] │ 0.2 │
╘════════════════╧═════╛
In [4]: quality.variables
Out[4]: OrderedDict([('Quality', [State(var='Quality', state=0),
                                  State(var='Quality', state=1),
                                  State(var='Quality', state=2)])])

In [5]: quality.cardinality
Out[5]: array([3])

In [6]: quality.values
Out[6]: array([0.3, 0.5, 0.2])
You can see here that the values of the CPD are a 1D array instead of a 2D array, which you passed as an argument. Actually, pgmpy internally stores the values of the TabularCPD as a flattened numpy array. We will see the reason for this in the next chapter.
In [7]: location = TabularCPD(variable='Location',
                              variable_card=2,
                              values=[[0.6], [0.4]])
In [8]: print(location)
╒═════════════════╤═════╕
│ ['Location', 0] │ 0.6 │
├─────────────────┼─────┤
│ ['Location', 1] │ 0.4 │
╘═════════════════╧═════╛
However, when we have conditional variables, we also need to specify them and the cardinality of those variables. Let's define the TabularCPD for the cost variable:
In [9]: cost = TabularCPD(
                      variable='Cost',
                      variable_card=2,
                      values=[[0.8, 0.6, 0.1, 0.6, 0.6, 0.05],
                              [0.2, 0.4, 0.9, 0.4, 0.4, 0.95]],
                      evidence=['Q', 'L'],
                      evidence_card=[3, 2])