
To develop an intuition for what these various calculations of variance are measuring, we can employ a technique called binning. Where data is continuous, using frequencies (as we did with the election data to count the nils) is not practical since no two values may be the same. However, it's possible to get a broad sense of the structure of the data by grouping the data into discrete intervals.
The process of binning is to divide the range of values into a number of consecutive, equally-sized, smaller bins. Each value in the original series falls into exactly one bin. By counting the number of points falling into each bin, we can get a sense of the spread of the data:
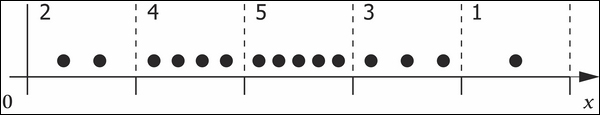
The preceding illustration shows fifteen values of x split into five equally-sized bins. By counting the number of points falling into each bin we can clearly see that most points fall in the middle bin, with fewer points falling into the bins towards the edges. We can achieve the same in Clojure with the following bin function:
(defn bin [n-bins xs]
  (let [min-x    (apply min xs)
        max-x    (apply max xs)
        range-x  (- max-x min-x)
        bin-fn   (fn [x]
                   (-> x
                       (- min-x)
                       (/ range-x)
                       (* n-bins)
                       (int)
                       (min (dec n-bins))))]
    (map bin-fn xs)))
For example, we can bin range 0-14 into 5 bins like so:
(bin 5 (range 15))

;; (0 0 0 1 1 1 2 2 2 3 3 3 4 4 4)
Once we've binned the values we can then use the frequencies function once again to count the number of points in each bin. In the following code, we use the function to split the UK electorate data into five bins:
(defn ex-1-11 []
  (->> (load-data :uk-scrubbed)
       (i/$ "Electorate")
       (bin 10)
       (frequencies)))

;; {1 26, 2 450, 3 171, 4 1, 0 2}
The count of points in the extremal bins (0 and 4) is much lower than the bins in the middle—the counts seem to rise up towards the median and then down again. In the next section, we'll visualize the shape of these counts.