
The analysis of data often results in a series of numbers representing the results of the analysis. However, for most people, this way of expressing results is not always intuitive. A better way to understand the results is to create graphs and charts to depict the results and the relationship between the elements of the result.
The human mind is often good at seeing patterns, trends, and outliers in visual representation. The large amount of data present in many data science problems can be analyzed using visualization techniques. Visualization is appropriate for a wide range of audiences ranging from analysts to upper-level management to clientele. In this chapter, we present various visualization techniques and demonstrate how they are supported in Java.
In Chapter 4, Data Visualization, we illustrate how to create different types of graphs, plots, and charts. These examples use JavaFX using a free library called GRAL(http://trac.erichseifert.de/gral/).
Visualization allows users to examine large datasets in ways that provide insights that are not present in the mass of the data. Visualization tools helps us identify potential problems or unexpected data results and develop meaningful interpretations of the data.
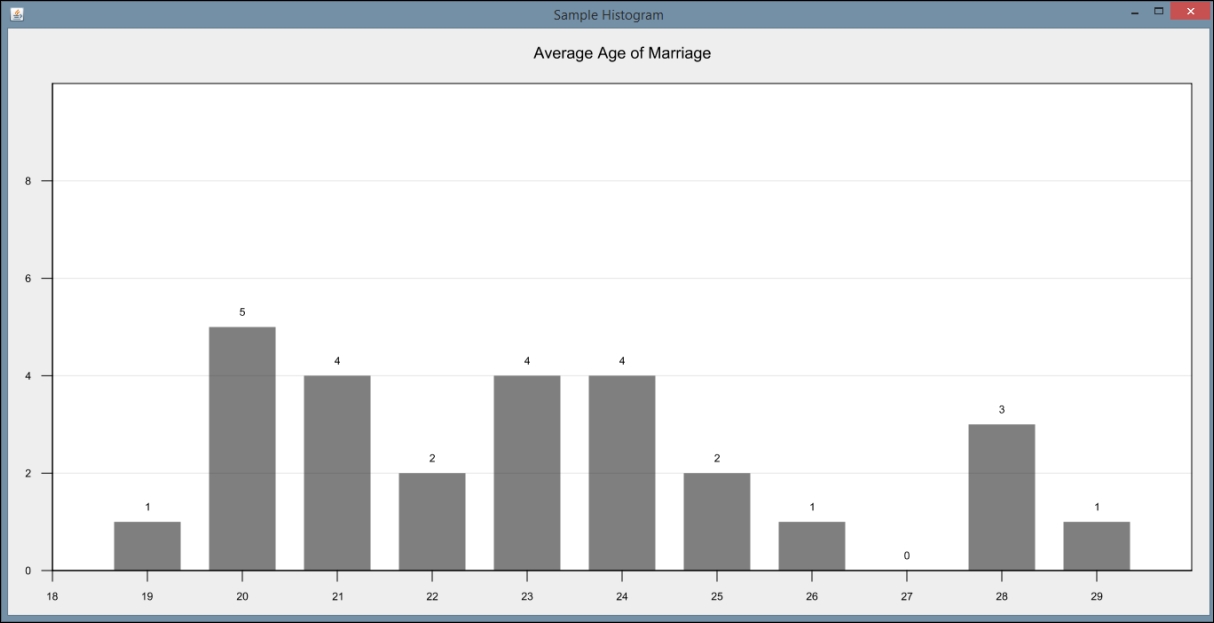
For example, outliers, which are values that lie outside of the normal range of values, can be hard to spot from a sea of numbers. Creating a graph based on the data allows users to quickly see outliers. It can also help spot errors quickly and more easily classify data.
For example, the following chart might suggest that the upper two values should be outliers that need to be dealt with: