
We will create a signal, transform it, and then shift the signal. Shift the frequencies with the following steps:
Create a cosine wave with
30points:x = np.linspace(0, 2 * np.pi, 30) wave = np.cos(x)
Transform the cosine wave with the
fft()function:transformed = np.fft.fft(wave)
Shift the signal with the
fftshift()function:shifted = np.fft.fftshift(transformed)
Reverse the shift with the
ifftshift()function. This should undo the shift. Check with the following code snippet:print(np.all((np.fft.ifftshift(shifted) - transformed) < 10 ** -9))
The result appears as follows:
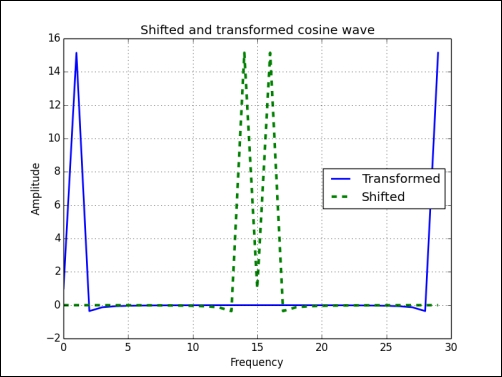
TruePlot the signal and transform it with matplotlib:
plt.plot(transformed, lw=2, label="Transformed")
plt.plot(shifted, '--', lw=3, label="Shifted")
plt.title('Shifted and transformed cosine wave')
plt.xlabel('Frequency')
plt.ylabel('Amplitude')
plt.grid()
plt.legend(loc='best')
plt.show()
The following diagram shows the effect of the shift and the FFT: