

Pearson's r, named after its developer Karl Pearson (1896), measures linear correlation between two variables. Let's look at the following equations:
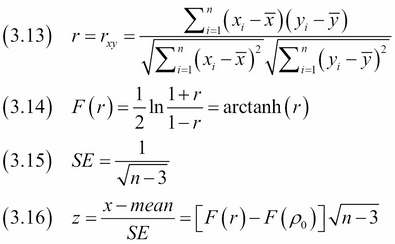
(3.13) defines the coefficient and (3.14) describes the
Fisher transformation used to compute confidence intervals. (3.15) gives the standard error of the correlation. (3.16) is about the z-score of the Fisher transformed correlation. If we assume a normal distribution, we can use the z-score to compute confidence intervals. Alternatively, we can bootstrap by resampling pairs of values with replacement. Also, the scipy.stats.pearsonr() function returns a p-value, which (according to the documentation) is not accurate for samples of less than 500 values. Unfortunately, we are going to use such a small sample in this recipe. We are going to correlate carbon dioxide emission data from the Worldbank with related temperature data for the Netherlands.